Full Report
The numbers behind Sunteck Realty Limited: as-reported financial statements and company metrics for FY2022–FY2026, traced to the source filings, opened with the share-price history those statements have to justify. Every linked figure opens the exact page of the filing it was printed on, with the statement row highlighted. Amounts in ₹ lakh unless noted.
Reading notes: All figures are consolidated and printed in ₹ lakh (1 lakh = 0.01 crore = ₹100,000), the unit used in Sunteck's own financial statements. 100 lakh = ₹1 crore. Core annual columns: FY2022–FY2025 are each cited to that fiscal year's OWN annual report (consolidated statements); FY2026 (year ended 31 March 2026) is cited to the audited consolidated financial results filed with the exchanges (the FY2026 annual report was not yet in the corpus), using the 'Year ended 31.03.2026' column. Revenue-by-stream (hero) uses Sunteck's own Note 30 'Revenue from operations' disaggregation. 'Other operating revenue' aggregates the note's minor operating lines (forfeiture income, sundry write-backs, other) and is shown uncited as the residual (Total minus the four named streams); it reconciles exactly to the sum of the note's other-operating-revenue sub-items each year. FY2026 stream split is not disclosed in the quarterly results, so only the FY2026 total is shown. FY2020–FY2021 long-term figures are cited to the FY2021 annual report (which prints both years). FY2017–FY2019 are from the standardized data feed / segment history and are shown without page links (no filing in the corpus).
Share Price — Full Available History — 16 Years
The stock closed at ₹315.00 on Jul 21, 2026 — up 28% over the window shown (+1.5% a year), trading between ₹88.97 and ₹630.05. At that close the stock trades at 23× FY2026 diluted EPS as reported below.
Source: market price feed, monthly closes, sampled from 4,076 source observations, Feb 2010–Jul 2026. Price return only, excludes dividends. Prices are split-adjusted (1:2 on Jul 25, 2017).
FY2026 at a Glance
Revenue (₹ lakh)
Net income (₹ lakh)
Diluted EPS
Source: FY2026 consolidated statements [1] [2] [3] [4]. Click any linked figure to open the filing page with the row highlighted.
Revenue from Operations by Stream
| Revenue from Operations by Stream | FY2022 | FY2023 | FY2024 | FY2025 | FY2026 |
|---|---|---|---|---|---|
| Sales of residential and commercial units (net) | 43,929 | 29,082 | 47,664 | 77,723 | — |
| Rent from properties | 830 | 939 | 3,679 | 4,994 | — |
| Construction | 4,475 | 3,389 | 2,322 | 50 | — |
| Maintenance | 1,217 | 1,821 | 2,268 | 2,012 | — |
| Other operating revenue | 856 | 1,015 | 553 | 535 | — |
| Total revenue from operations | 51,308 | 36,245 | 56,485 | 85,313 | 112,384 |
| Total revenue from operations growth, derived | — | -29.4% | +55.8% | +51.0% | +31.7% |
Source: Consolidated Note 30 'Revenue from operations' (FY2022–FY2025 annual reports); FY2026 total from the audited consolidated results. 'Other operating revenue' aggregates the note's forfeiture income and other minor operating lines. [1] [5] [6] [7]. Click any linked figure to open the filing page with the row highlighted.
Income Statement
Source: Consolidated Statement of Profit and Loss (FY2022–FY2025 annual reports; FY2026 audited consolidated results, year-ended 31 March 2026 column) [1] [2] [3] [4]. Click any linked figure to open the filing page with the row highlighted.
Columns marked E are consensus analyst estimates shown alongside reported results for direct comparison; they are not company guidance.
Estimate source: Yahoo Finance analyst consensus, as of 2026-07-21. Estimate figures link to the consensus source, not to filing pages.
Balance Sheet
| Balance Sheet | FY2022 | FY2023 | FY2024 | FY2025 | FY2026 |
|---|---|---|---|---|---|
| Property, plant and equipment | 4,737 | 5,224 | 6,477 | 7,223 | 7,725 |
| Investment properties | 7,503 | 9,673 | 42,335 | 42,277 | 55,857 |
| Investments in joint venture accounted using equity method | 23,295 | 23,076 | 22,713 | 23,336 | 6,956 |
| Total non-current assets | 50,433 | 66,560 | 102,850 | 102,592 | 101,127 |
| Inventories | 404,189 | 572,512 | 596,628 | 620,641 | 789,571 |
| Trade receivables | 27,052 | 14,962 | 29,253 | 11,745 | 11,254 |
| Cash and cash equivalents | 6,454 | 8,881 | 5,970 | 16,404 | 5,442 |
| Total current assets | 499,454 | 659,303 | 689,514 | 730,063 | 890,156 |
| Total assets | 549,887 | 725,863 | 792,364 | 832,655 | 991,284 |
| Equity share capital | 1,404 | 1,405 | 1,465 | 1,465 | 1,468 |
| Other equity | 277,636 | 277,381 | 310,955 | 324,538 | 359,639 |
| Total equity | 279,040 | 278,786 | 312,420 | 326,003 | 447,213 |
| Borrowings (non-current) | 43,982 | 42,084 | 25,067 | 15,554 | 47,761 |
| Borrowings (current) | 34,712 | 26,458 | 12,427 | 23,140 | 29,656 |
| Liabilities towards land owners for joint development arrangements | — | 261,839 | 280,902 | 305,622 | 323,812 |
| Total current liabilities | 225,149 | 403,491 | 451,861 | 488,242 | 492,958 |
| Total liabilities | 270,847 | 447,077 | 479,945 | 506,652 | 544,070 |
Source: Consolidated Balance Sheet (FY2022–FY2025 annual reports; FY2026 audited consolidated results, as-at 31 March 2026 column) [8] [9] [10] [11]. Click any linked figure to open the filing page with the row highlighted.
Cash Flow
| Cash Flow | FY2022 | FY2023 | FY2024 | FY2025 | FY2026 |
|---|---|---|---|---|---|
| Net cash generated from/(used in) operating activities | (3,093) | 26,204 | 10,899 | 18,984 | (43,250) |
| Purchase of property, plant and equipment, investment properties and intangibles | (1,827) | (1,812) | (6,315) | (3,252) | (15,667) |
| Net cash generated from/(used in) investing activities | 3,333 | (1,624) | 25,109 | (3,670) | (17,409) |
| Net cash generated from/(used in) financing activities | 4,590 | (26,138) | (35,271) | (10,348) | 53,809 |
| Dividends paid | (1,420) | (2,106) | (2,108) | (2,198) | — |
| Net increase/(decrease) in cash and cash equivalents | 4,830 | (1,558) | 737 | 4,966 | (6,850) |
| Free cash flow, derived | (4,920) | 24,393 | 4,584 | 15,732 | (58,917) |
Source: Consolidated Statement of Cash Flow (FY2022–FY2025 annual reports; FY2026 audited consolidated results). Each year cites its own report's primary column. [12] [13] [14] [15]. Click any linked figure to open the filing page with the row highlighted.
Pre-Sales Cash Collections
| Pre-Sales Cash Collections | FY2022 | FY2023 | FY2024 | FY2025 | FY2026 |
|---|---|---|---|---|---|
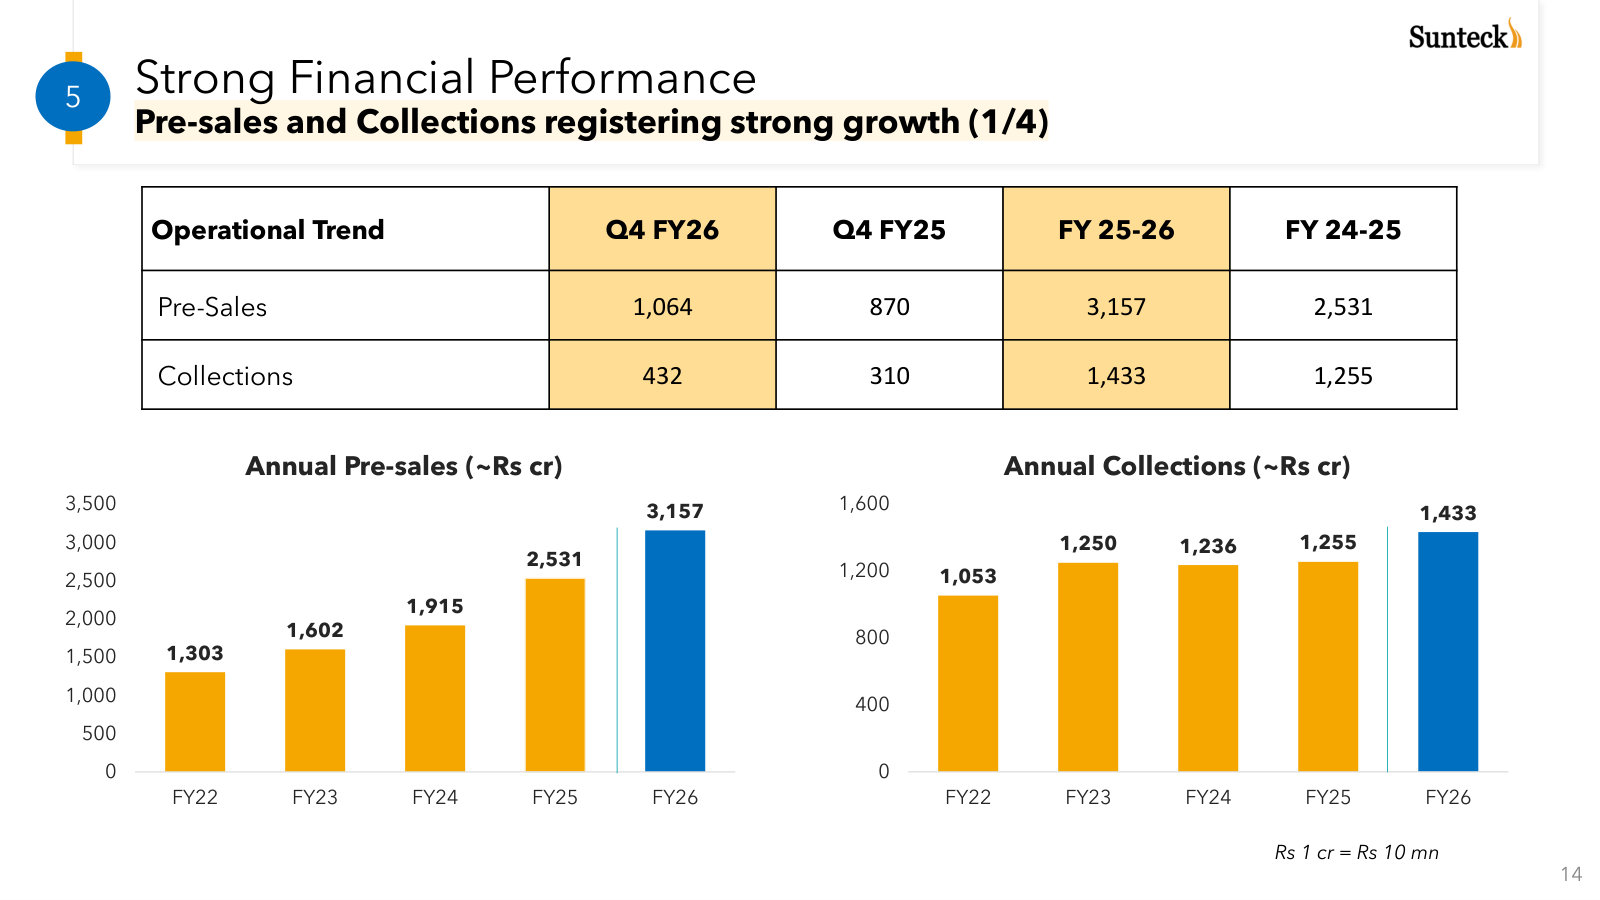
| Pre-sales (bookings value) | 130,300 | 160,200 | 191,500 | 253,100 | 315,700 |
| Gross cash collections | 105,300 | 125,000 | 123,600 | 125,500 | 143,300 |
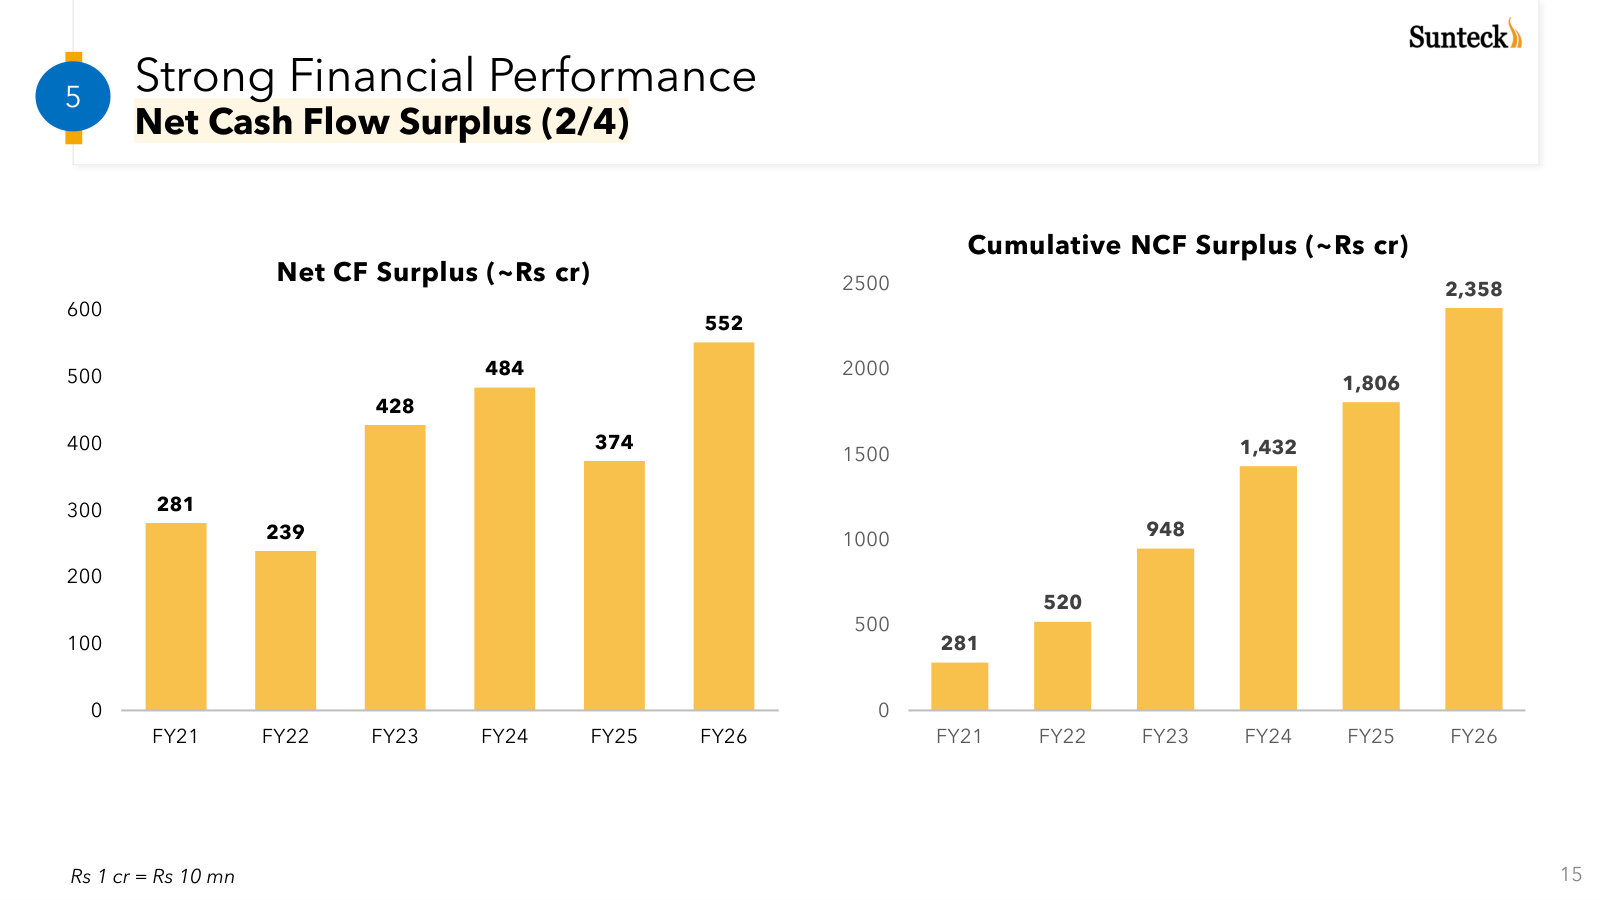
| Net cash flow surplus | 23,900 | 42,800 | 48,400 | 37,400 | 55,200 |
| Amount spent on business development (BD/LO/JDA) | — | — | — | 18,400 | 81,300 |
Source: company filings [16] [17] [18]. Click any linked figure to open the filing page with the row highlighted.
Development Pipeline (GDV Portfolio)
| Development Pipeline (GDV Portfolio) | FY2022 | FY2023 | FY2024 | FY2025 | FY2026 |
|---|---|---|---|---|---|
| Balance gross development value (GDV) | 1,365,000 | 1,934,500 | 2,664,500 | 3,937,000 | 4,103,000 |
| Portfolio saleable area (msf) | — | — | — | — | 50 |
| Joint-development / JV area (msf) | — | — | — | — | 36 |
Source: company filings [19] [20]. Click any linked figure to open the filing page with the row highlighted.
Profitability Leverage
| Profitability Leverage | FY2022 | FY2023 | FY2024 | FY2025 | FY2026 |
|---|---|---|---|---|---|
| EBITDA | — | — | — | 18,600 | 30,500 |
| EBITDA margin | — | — | — | 22.0% | 27.0% |
| PAT margin | — | — | — | 18.0% | 18.0% |
| Gross debt | — | 59,300 | 29,500 | 33,600 | 74,700 |
| Net debt | — | 28,000 | (800) | (12,500) | 26,600 |
| Net debt / equity | — | 0.1 | 0.0 | (0.0) | 0.1 |
Source: company filings [21] [22]. Click any linked figure to open the filing page with the row highlighted.
Long-Term Record
| Fiscal year | Total revenue from operations | Net profit for the year | Diluted EPS | Operating cash flow | Total equity |
|---|---|---|---|---|---|
| FY2017 | 95,220 | — | — | — | — |
| FY2018 | 88,829 | — | — | — | — |
| FY2019 | 85,679 | 24,112 | 16.20 | — | 292,475 |
| FY2020 | 55,972 | 7,487 | 5.27 | (7,796) | 274,872 |
| FY2021 | 61,386 | 4,194 | 2.98 | 28,615 | 277,225 |
| FY2022 | 51,308 | 2,508 | 1.79 | (3,093) | 279,040 |
| FY2023 | 36,245 | 141 | 0.10 | 26,204 | 278,786 |
| FY2024 | 56,485 | 7,093 | 4.99 | 10,899 | 312,420 |
| FY2025 | 85,313 | 15,032 | 10.26 | 18,984 | 326,003 |
| FY2026 | 112,384 | 20,207 | 13.94 | (43,250) | 447,213 |
Source: consolidated statements across filings; older years from the standardized feed [12] [8] [1] [14]. Click any linked figure to open the filing page with the row highlighted.
Analyst Consensus
Current price
Mean target
Median target
High target
Low target
Estimate source: Yahoo Finance analyst consensus, as of 2026-07-21. Estimate figures link to the consensus source, not to filing pages.
Traceability
339 of 350 figures on this page (97%) link to the filing page where they are printed — click a linked figure to open the source PDF at that page with the row highlighted. Unlinked figures come from standardized data feeds or pre-filing years.
All figures are consolidated and printed in ₹ lakh (1 lakh = 0.01 crore = ₹100,000), the unit used in Sunteck's own financial statements. 100 lakh = ₹1 crore.
Core annual columns: FY2022–FY2025 are each cited to that fiscal year's OWN annual report (consolidated statements); FY2026 (year ended 31 March 2026) is cited to the audited consolidated financial results filed with the exchanges (the FY2026 annual report was not yet in the corpus), using the 'Year ended 31.03.2026' column.
Revenue-by-stream (hero) uses Sunteck's own Note 30 'Revenue from operations' disaggregation. 'Other operating revenue' aggregates the note's minor operating lines (forfeiture income, sundry write-backs, other) and is shown uncited as the residual (Total minus the four named streams); it reconciles exactly to the sum of the note's other-operating-revenue sub-items each year. FY2026 stream split is not disclosed in the quarterly results, so only the FY2026 total is shown.
FY2020–FY2021 long-term figures are cited to the FY2021 annual report (which prints both years). FY2017–FY2019 are from the standardized data feed / segment history and are shown without page links (no filing in the corpus).
Sunteck reports a single operating segment (Real Estate/Real Estate Development and Related Activities) under Ind AS 108, so no segment-profit statement is presented; the revenue-stream breakdown is the meaningful revenue cut.
EPS is on a face value of ₹1 per share; no stock split or bonus occurred within the quarterly window, so quarterly EPS is stated as printed (eps_split_adjusted = false).
FY2022 'Total tax expense' (746.17) is the sum of the printed Current tax (285.82) and Deferred tax (460.35); the FY2022 consolidated P L prints no combined tax-total line, so that one cell is shown uncited.
FY2026 investment in joint ventures fell to 6,955.68 lakh (from 23,335.93) as a former joint venture was consolidated (non-controlling interest of 86,105.84 lakh appears for the first time in FY2026); this also lifts inventories and total assets.
Quarterly block shows single-quarter consolidated income statements (Indian results filings print the income statement only, not full quarterly balance sheets/cash flows).
4 figure(s) differed between the data feed and the filing; the filing value is shown (see the run's metrics/metrics_tab.json for the audit trail).
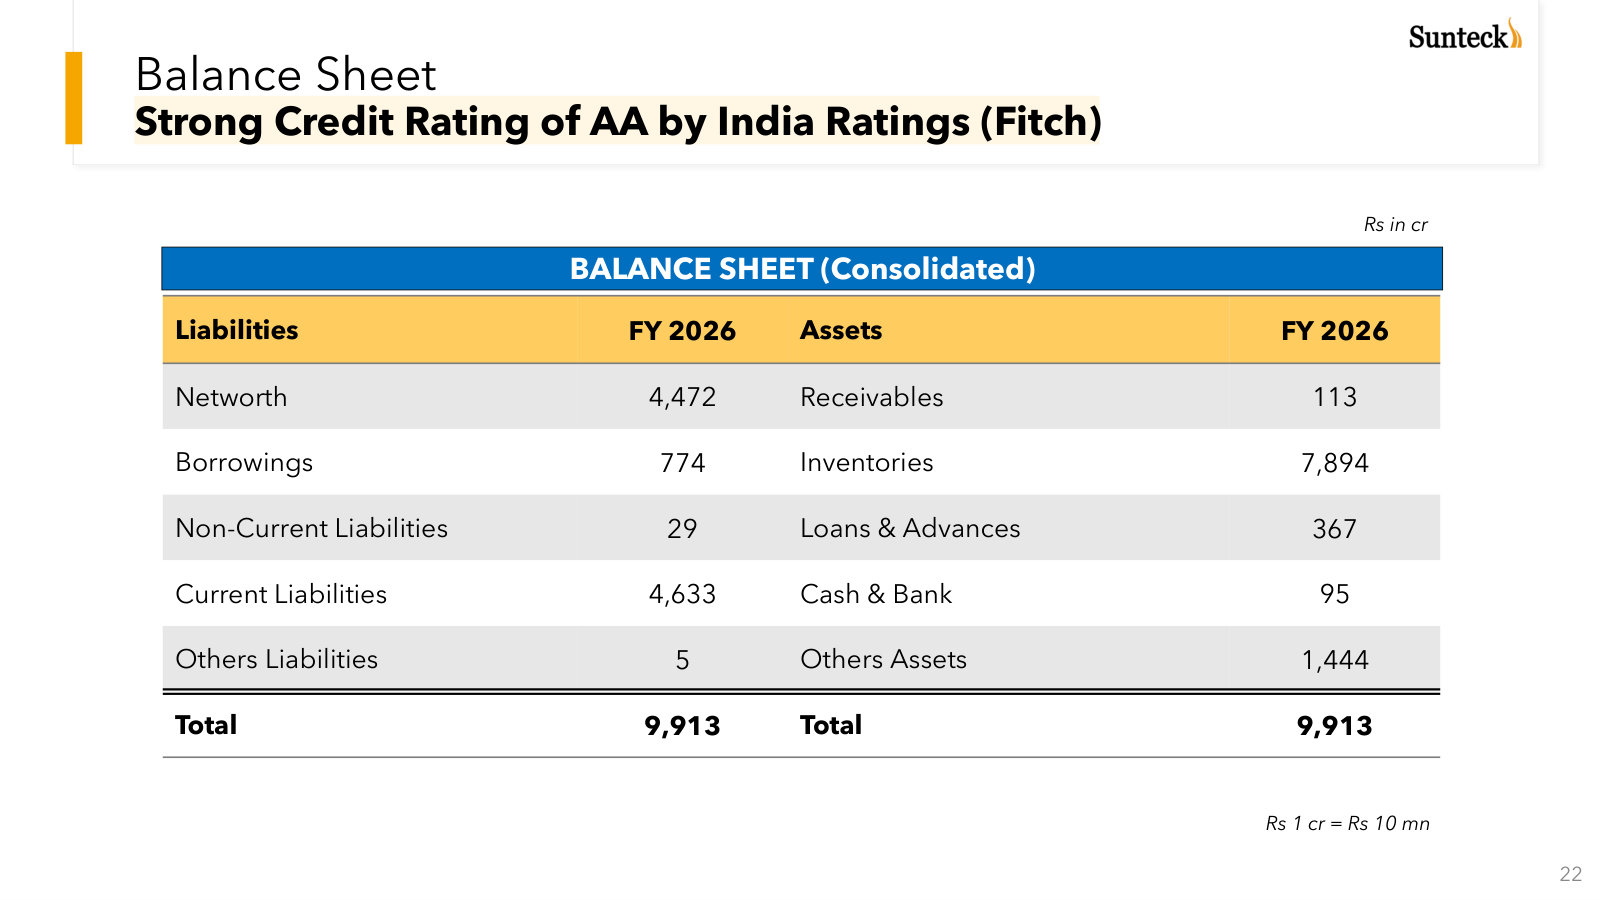
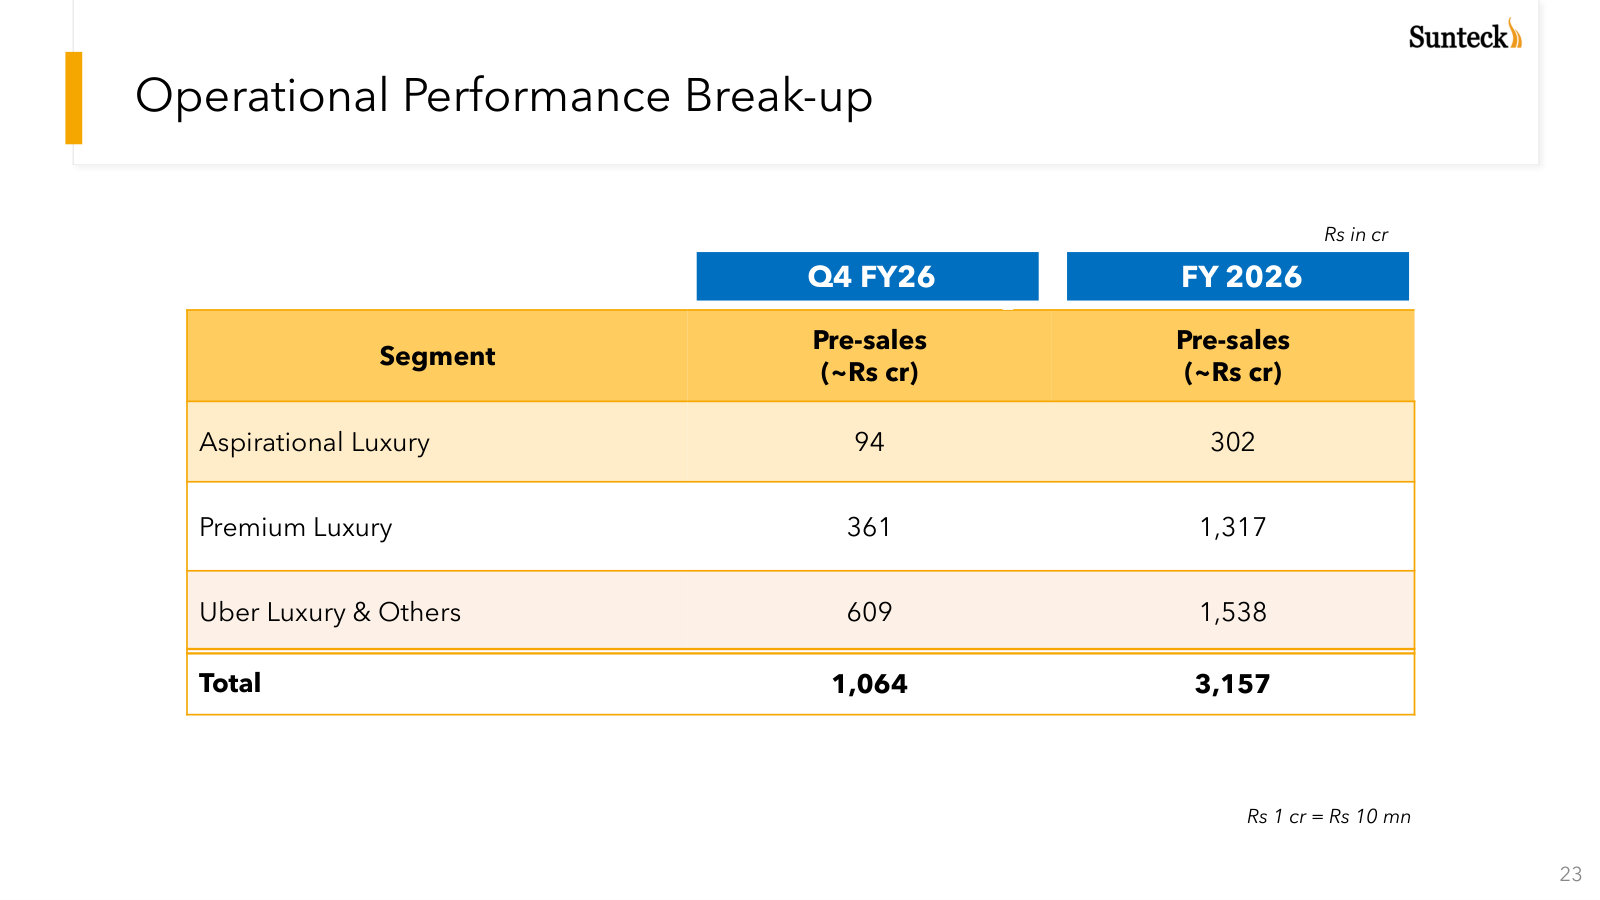
Sunteck Realty Limited's management explains the business in its own materials. The slides below do the most of that work, pulled from the documents preserved in Sources. Each source link opens the complete presentation at that slide in a new tab.
Investor Presentation — Q4 & Full Year FY2026 — Q4 & FY2026
Management's fullest current statement of the business: MMR luxury-housing model, land bank, cash generation and balance sheet, all in one deck. · Open the full document →
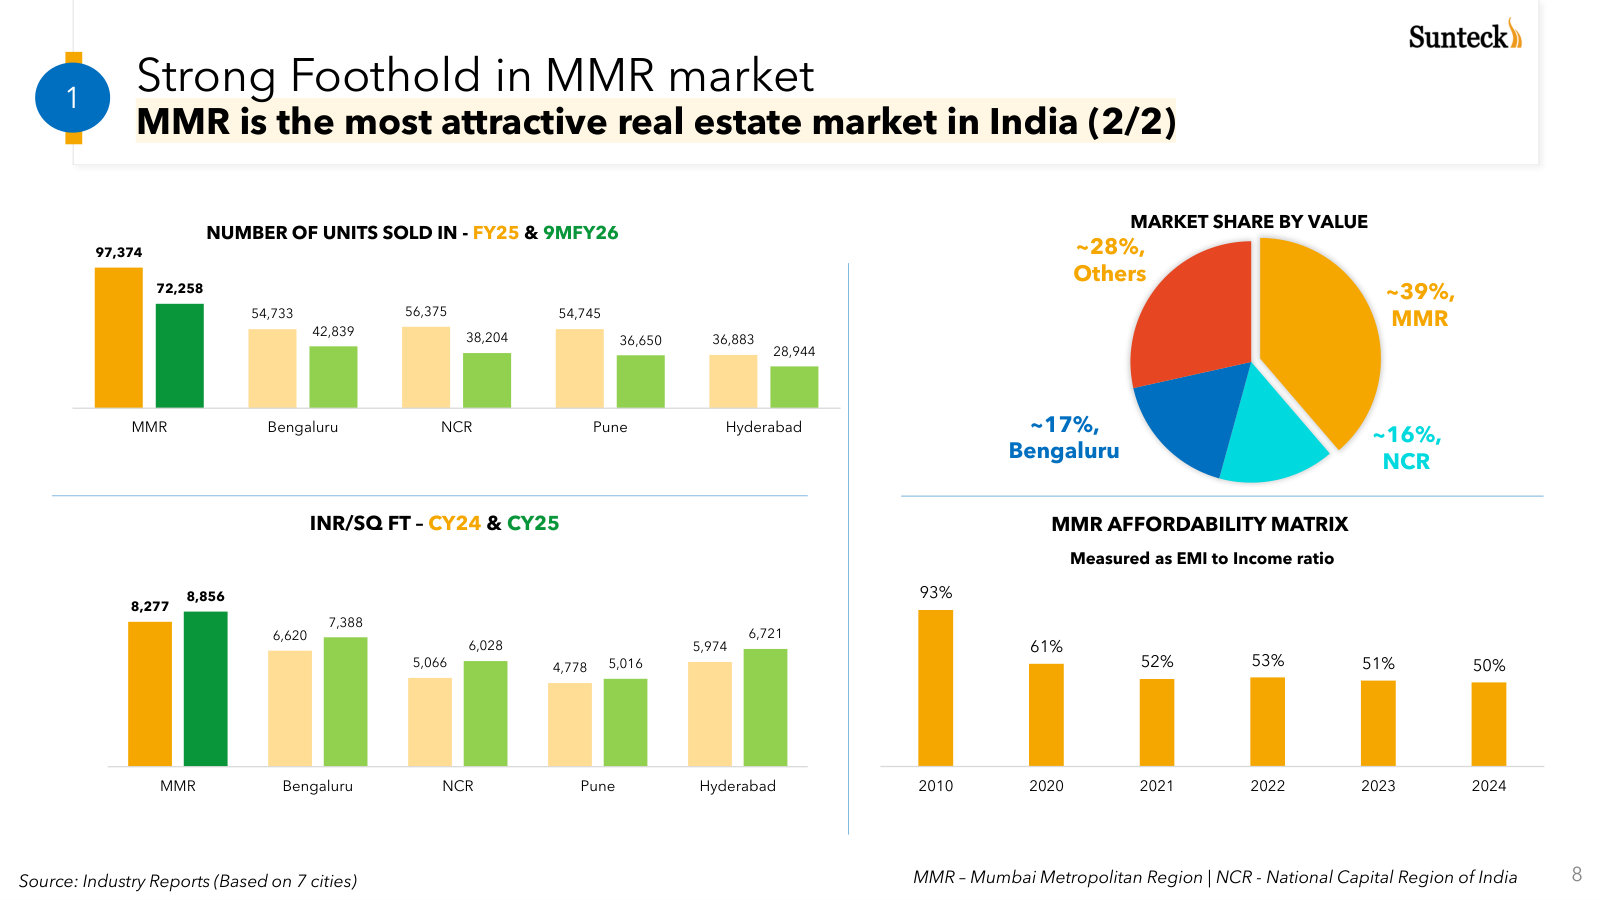
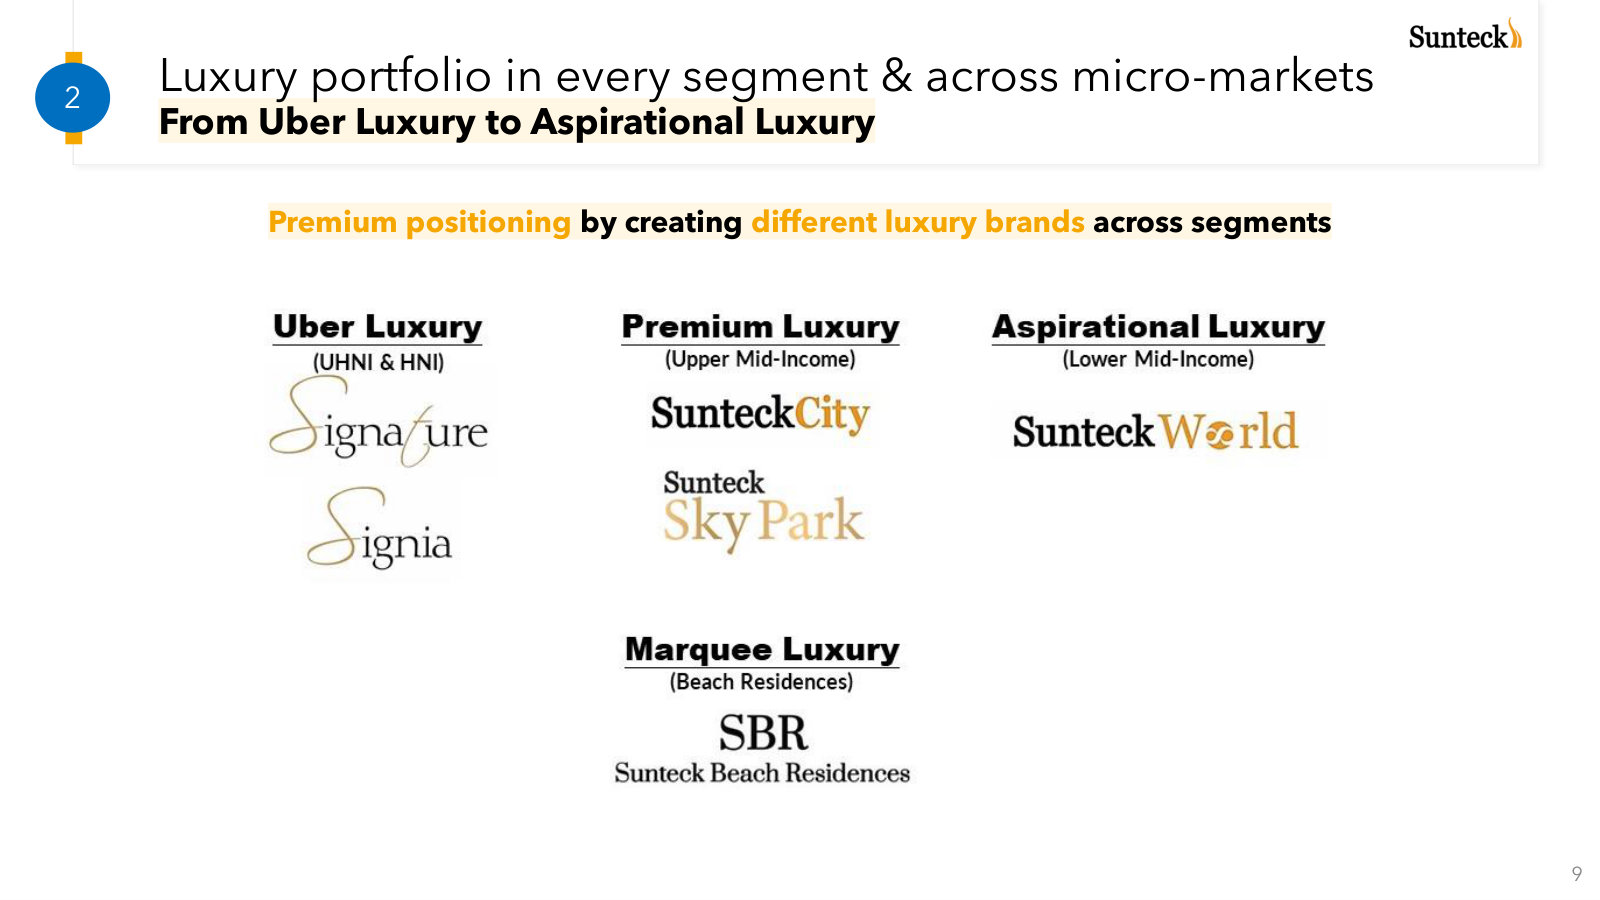
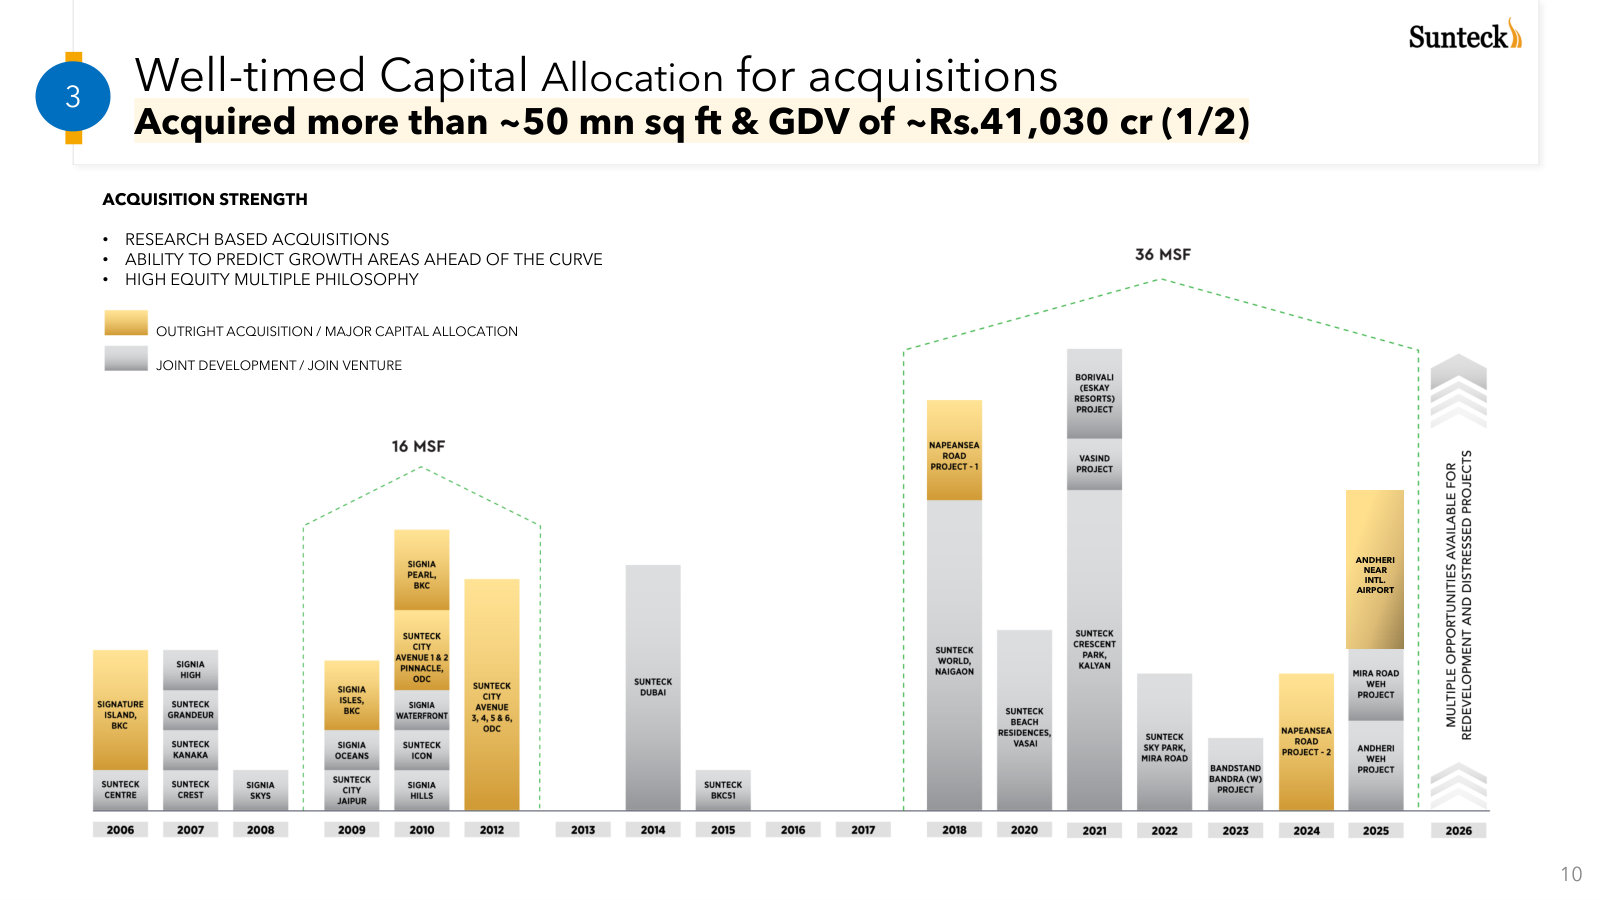
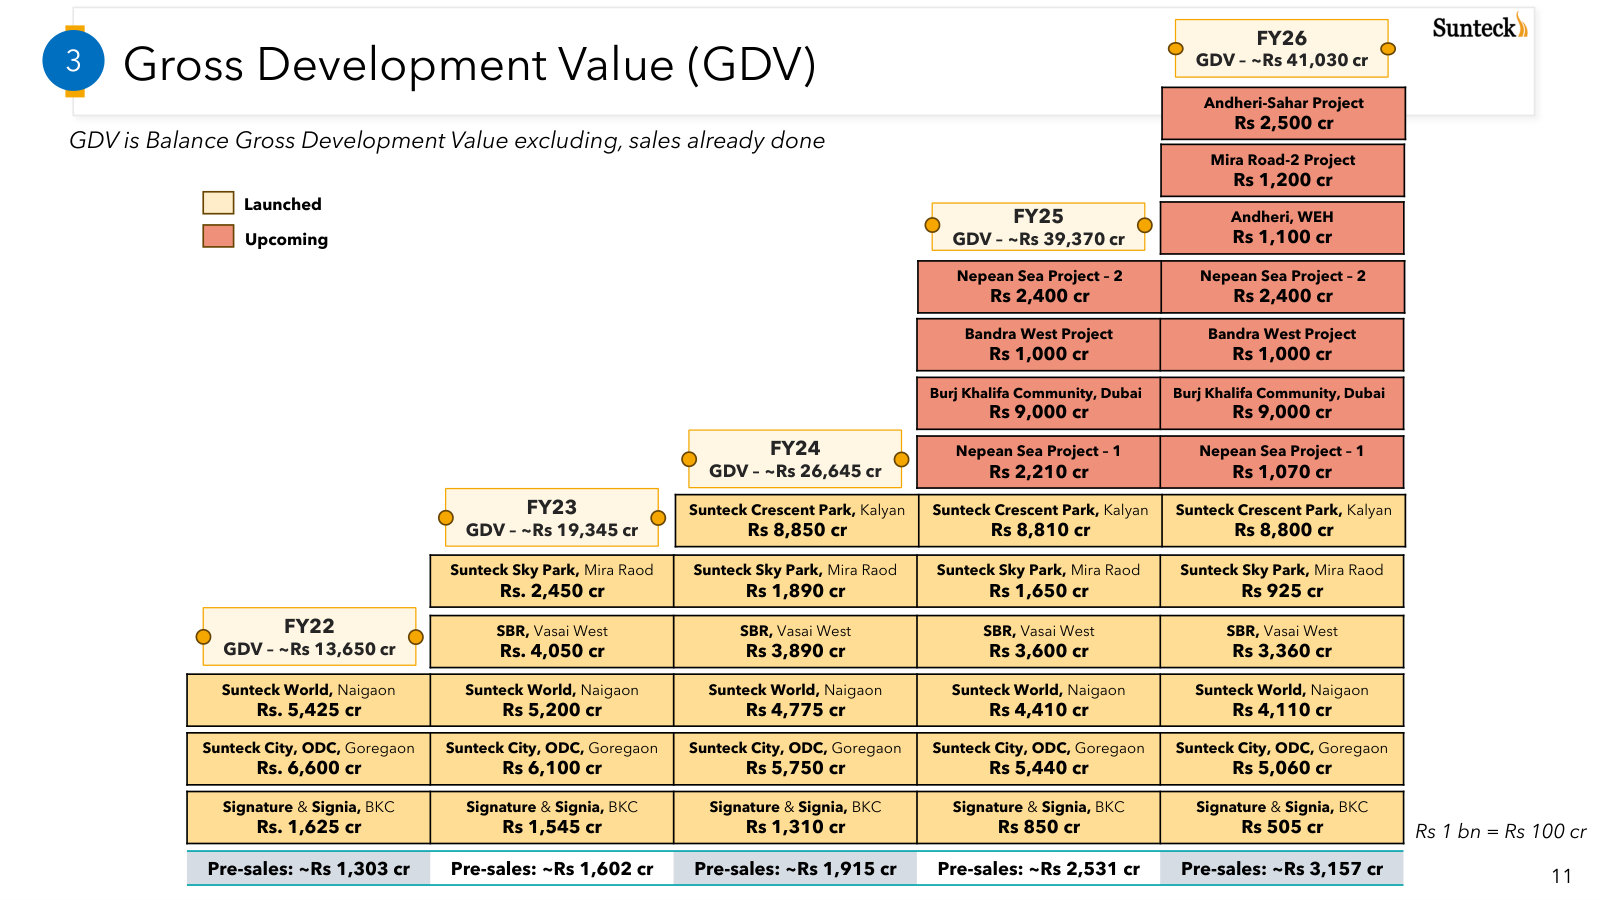
More from management
Investor Presentation — Q4 & Full Year FY2025 — Q4 & FY2025 · 30 pages · The prior full-year deck — same story a year earlier, and it lists the specific projects under each luxury brand. · Open →
Investor Presentation — Q4 & Full Year FY2024 — Q4 & FY2024 · 31 pages · The FY2024 baseline this management is measured against — where pre-sales, GDV and leverage stood two years ago. · Open →
Sunteck Realty Limited's management answers for the business every quarter. These are the exchanges that explain it best — verbatim, from the call transcripts preserved in Sources. Each link opens the full transcript at that page in a new tab.
Q4 & FY2026 Earnings Conference Call — Q4 FY2026
The latest full-year call: how the pre-sales cash engine self-funds record land buying, and the unit economics behind the flagship Dubai bet. · Open the full transcript →
The self-funding model in one line: record land spend, still near-zero leverage.
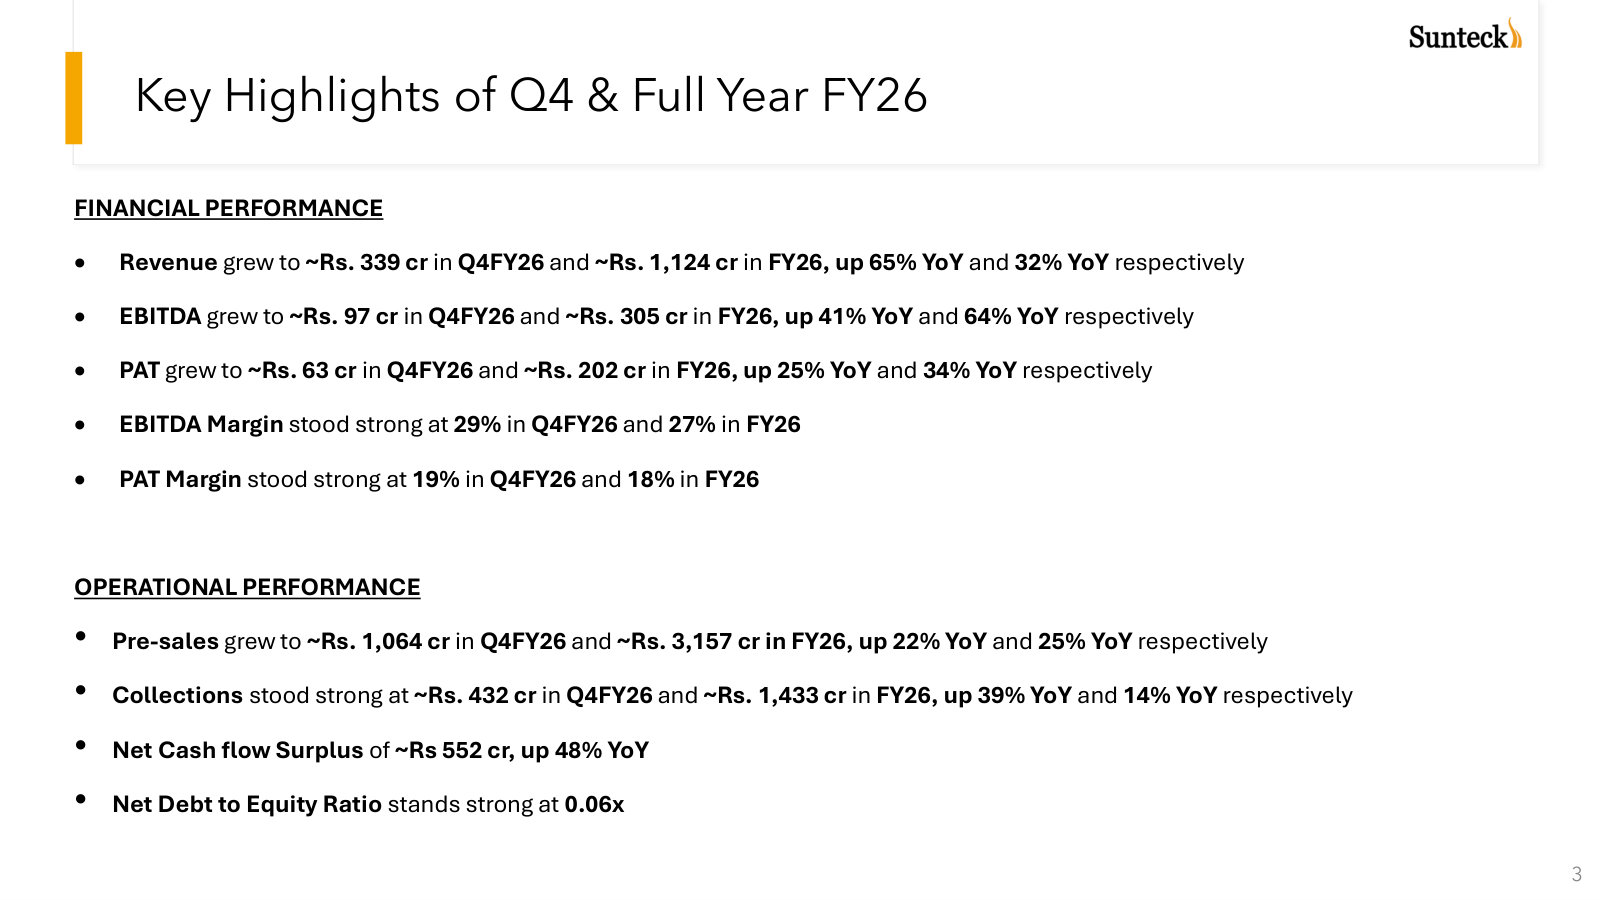
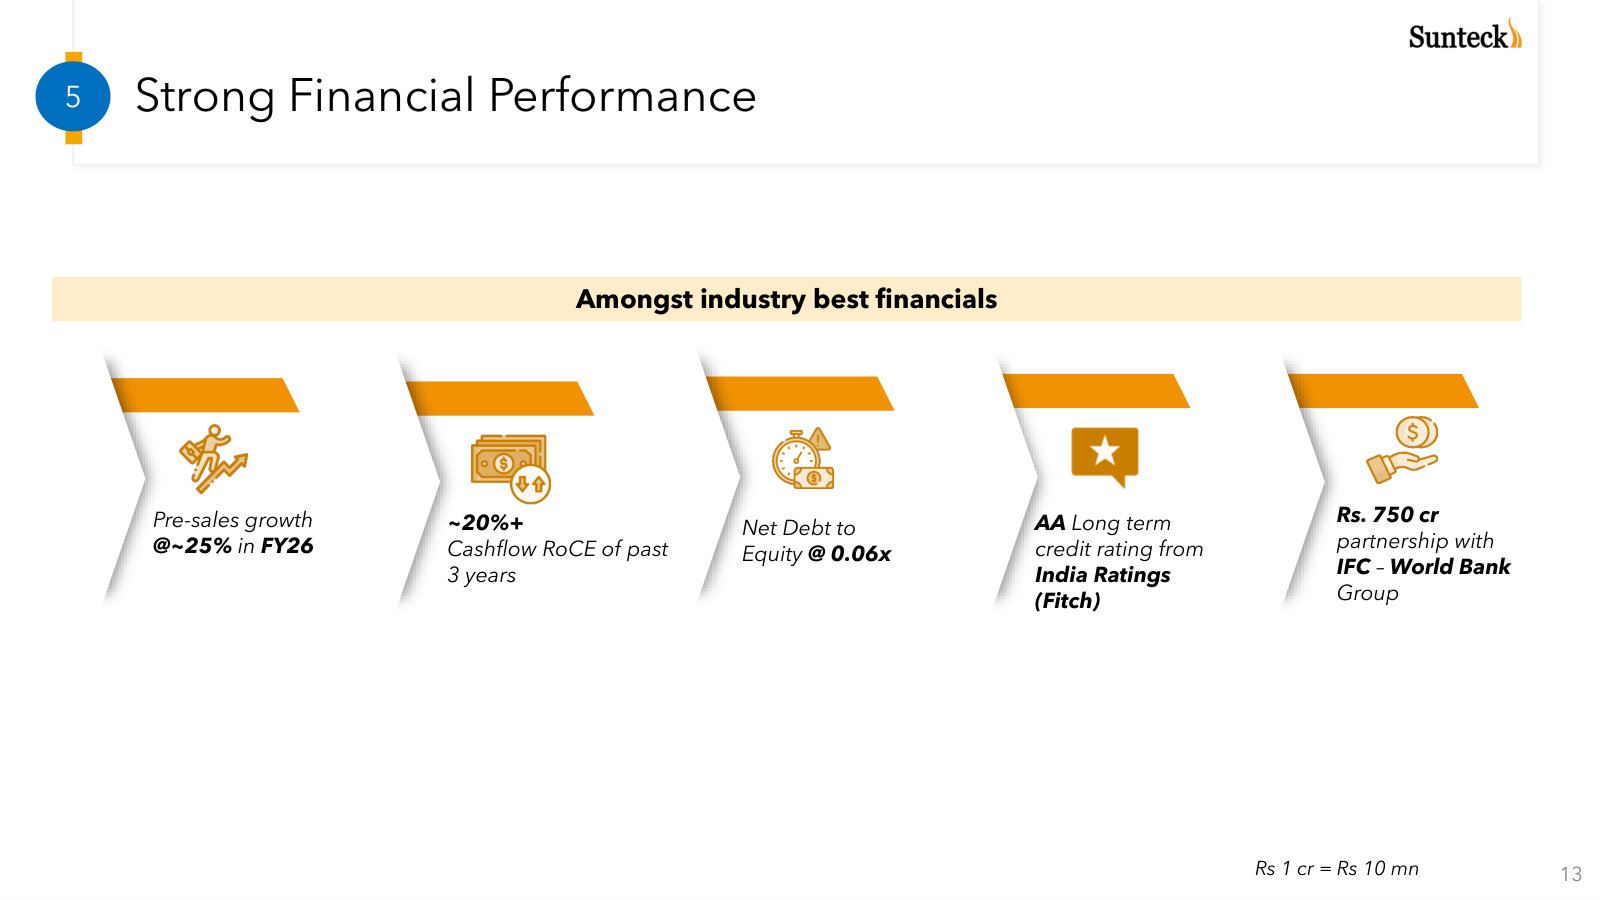
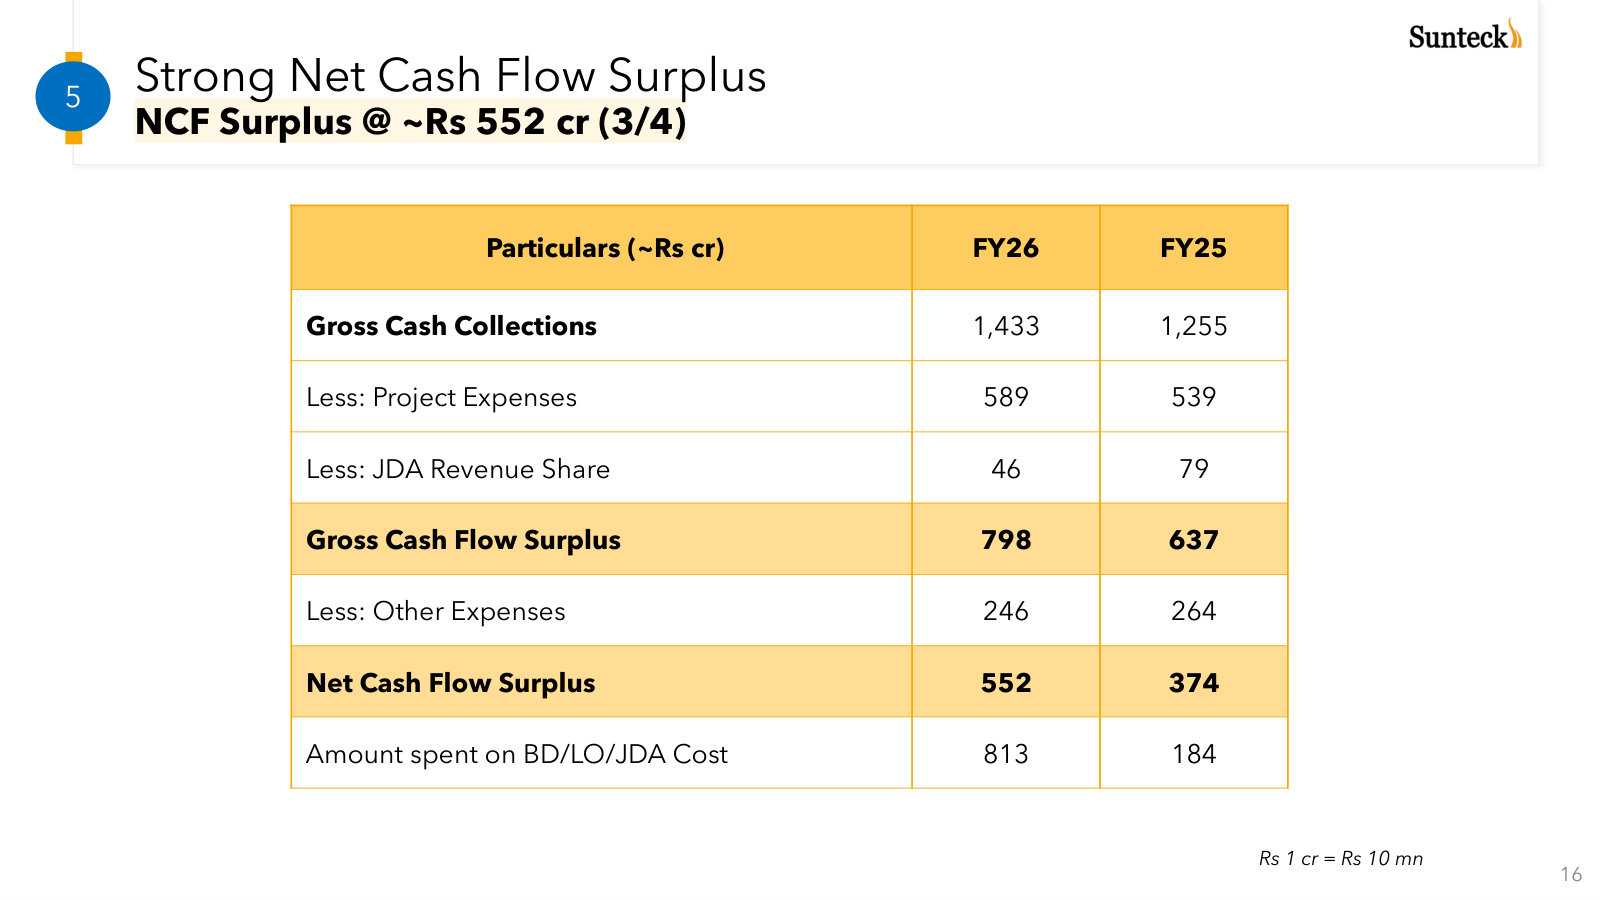
Kamal Khetan (Chairman & Managing Director): On the cash flow front, we have generated a strong net cash flow surplus of INR5.5 billion for the full year FY '26, representing a growth of 48% year-on-year. This has enabled us to maintain our net debt to equity at negligible level of 0.06x despite the strong investment in business development. We have invested INR8.1 billion in full year of FY '26 compared to INR1.8 billion for full year of FY '25.
p. 4 · Read in context →
The cash-conversion gap analysts watch: collections up 14% against 25% sales growth.
Kunal Lakhan (CLSA); Kamal Khetan (CMD): The collections grew 14% Y-o-Y. Significantly lower than the sales growth of 25%, right? And is a collection as a percentage of sales also like it's less than 50%. I mean in terms of cash flow most so driven by collections we should see a substantial jump going into FY '27, right? […] Yes definitely. So FY '27 we will have a better – obviously percentage. That's why you see the growth will continue to grow – it will have to become better and better. Yes I agree with you. FY '27 and FY '28 you will see a very, very strong cash flow.
p. 5 · Read in context →
Unit economics of the Dubai land bet: low entry cost plus currency gain implies a 20x return.
Kamal Khetan (CMD); Puneet (HSBC): we have partnered with the landlord at AED385 million. And those days, we have sent AED70 million to Dubai, only AED70 million, and that's to become a 50% partner in the 385 million property. […] Today even if I consider a land value of INR1.6 billion, it is INR800 million, so 10x.And plus the currency benefit, which Sunteck transferred at INR12 to a dirham or INR13 to a dirham, which is now today INR24 to INR25. So we are talking about 20x of the investment done by Sunteck.
p. 9 · Read in context →
Pricing discipline: growth is being sold without discounts, protecting next year's margins.
Kamal Khetan (CMD); Akash Gupta (Nomura): There is absolutely no discount. If there is a discount then I would not be able to give a better margin coming year for sure. Everything is as usual.
p. 13 · Read in context →
Q3 & 9M FY2026 Earnings Conference Call — Q3 FY2026
Where the demand thesis got tested: management on a 'fragile' market, richer pricing, and the RERA-free way it pre-sells Nepean Sea Road. · Open the full transcript →
Why margins are improving: new Goregaon pricing is set above the prior cycle's realizations.
Kamal Khetan (CMD); Abhinav Sinha (Jefferies): when it comes to ODC, Goregaon West, obviously, our pricing is higher than what we were selling. So that's why you will also see our margins getting better.
p. 6 · Read in context →
The redevelopment mechanic that lets Nepean Sea Road book sales before RERA approval.
Kamal Khetan (CMD); Abhishek Khanna (Kotak Securities): So obviously, RERA approval is not received there. And this is all what the tenancy sales are happening, which does not require the RERA approval.
p. 6 · Read in context →
Q4 & FY2024 Earnings Conference Call — Q4 FY2024
The clearest statement of the growth roadmap and capital-allocation rules: double the GDV, stay net-debt-zero, and redeploy cash at 30% ROI. · Open the full transcript →
The balance-sheet base of the model: net-debt-zero with gross debt down 58% since FY22.
Kamal Khetan (Chairman & Managing Director): This has led to Sunteck achieving net debt zero as at the end of FY'24, yet again demonstrating our financial prudence. Gross debt is down 58% since FY'22 and stands at just INR295 crores with a gross debt to equity ratio at 0.09. We believe we have a strong and liquid balance sheet and this gears up to do more work.
p. 3 · Read in context →
The growth roadmap: doubling GDV from INR30,000cr to INR60,000cr on industry consolidation.
Kamal Khetan (CMD): we have embarked on the ambitious yet achievable roadmap of doubling our GDV, which is gross development value, from INR30,000 crores to INR60,000 crores in the coming years.
Our confidence to achieve this stems from our strong foothold in the market and our ability to capitalize on the deep consolidation within the industry. In the past, through meticulous planning and execution, we have seen our GDV double in less than three years till end of FY'24.
p. 4 · Read in context →
Capital discipline: the annual fundraise is only an enabling resolution, not a plan to dilute.
Kamal Khetan (CMD); Kunal Lakhan (CLSA): as a practice, we have been taking this for the years from last few years that this enabling resolution is always there. But obviously, we don't plan to raise any equity or increase the debt, we are already net debt positive.
p. 5 · Read in context →
Q4 & FY2023 Earnings Conference Call — Q4 FY2023
The foundation call: the cash-flow-and-deleveraging engine, the annuity portfolio's start, and the 'land as raw material' philosophy in the founder's words. · Open the full transcript →
The cash-flow engine and deleveraging: ~INR950cr of three-year surplus, net D/E cut to 0.1.
Kamal Khetan (Chairman & Managing Director): We closed FY23 with Rs. 1602 crore in pre-sales and Rs. 1,250 crore in collections.
The strong operational performance has enabled us to generate more than Rs. 425 crore of surplus operating cash flow in FY23. Cumulatively, over the last three financial years, we have generated close to Rs. 950 crore of surplus operating cash flow. This has allowed us to not only do aggressive acquisitions but also enabled us to reduce our already negligible net debt-equity ratio in the last three years from 0.22 to 0.1.
p. 3 · Read in context →
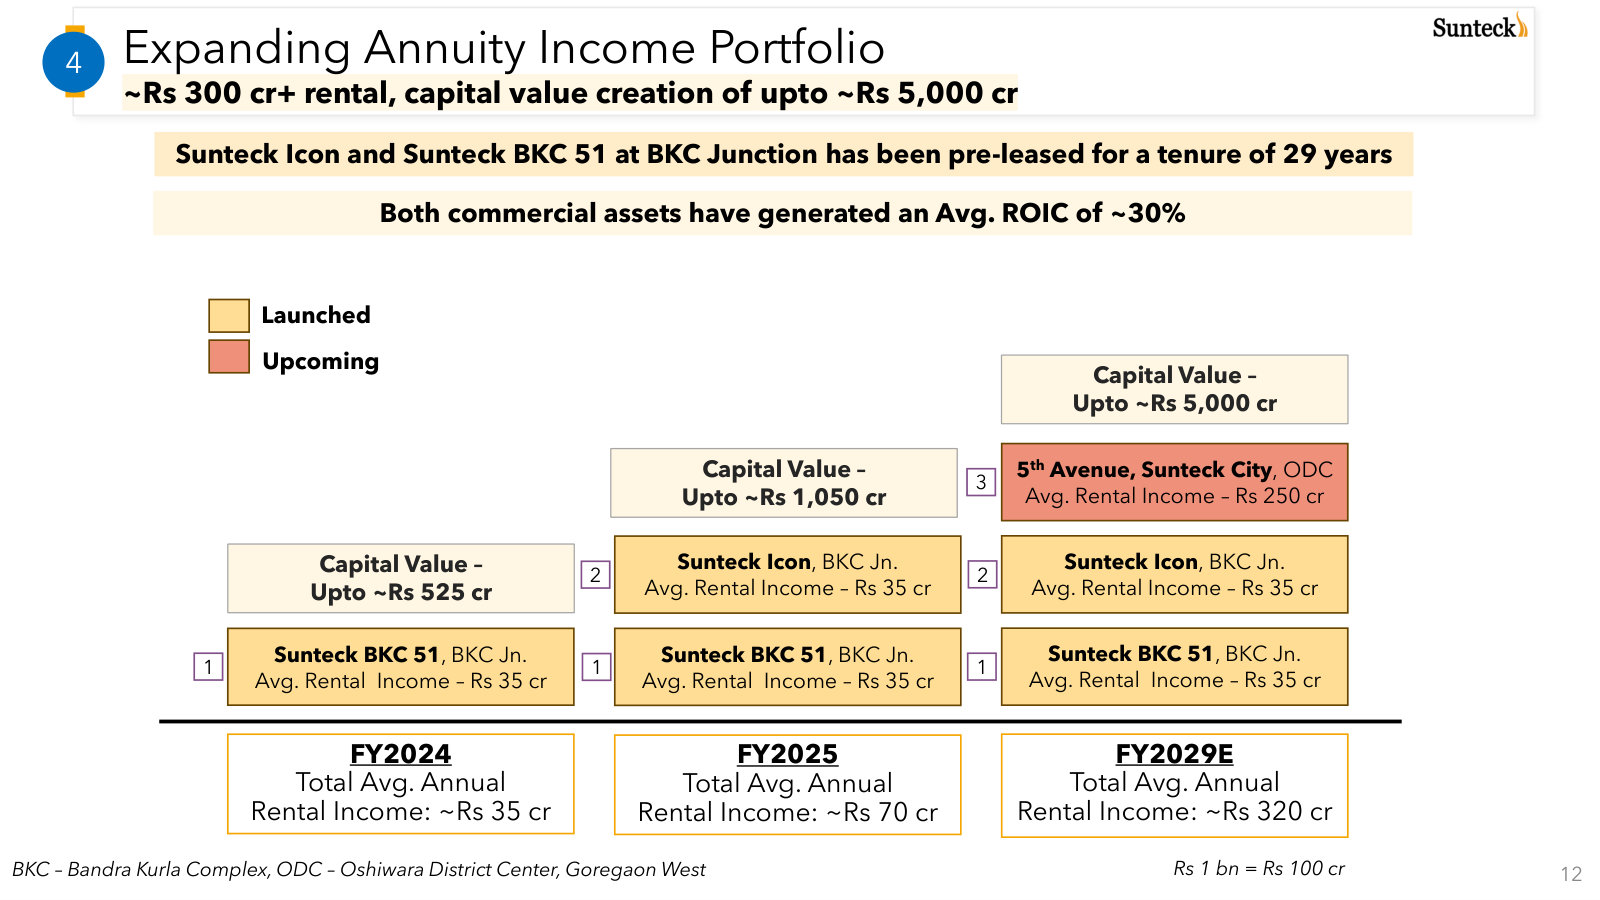
The annuity pillar begins: BKC51 pre-leased for a 29-year term, Icon to follow.
Kamal Khetan (CMD): we are also now focusing on building a rental portfolio from our commercial projects and to mention we have already pre-leased the entire project of Sunteck BKC51 at BKC Junction for lease tenure of 29 years. Similarly, we are looking to prelease our second project also at BKC Junction, namely Sunteck Icon.
p. 4 · Read in context →
A candid miss: management owns falling short of the ~INR1,800cr target on a delayed launch.
Kamal Khetan (CMD); Abhinav Sinha (Jefferies India): So, Abhinav obviously as I said, we were expecting this Sky Park launch to be earlier than March, we were looking at Q3. Anyhow, we managed to launch in Q4 and that too also towards the last month of Q4 because of that we got short of our target
p. 5 · Read in context →
More calls
Q4 & FY2025 Earnings Conference Call — Q4 FY2025 · 7 pages · The FY25 annual wrap: pre-sales of INR2,531cr (+32%), the cash-flow ROCE framing, and how the Nepean Sea Road pre-sales work under tenancy/redevelopment rights. · Open →
Q2 & H1 FY2026 Earnings Conference Call — Q2 FY2026 · 9 pages · Introduces the by-invitation 'Emaance' luxury brand and the Nepean Sea Road marquee positioning, alongside the H1 FY26 margin step-up. · Open →
Q1 FY2026 Earnings Conference Call — Q1 FY2026 · 7 pages · The FY26 launch plan laid out: a target of ~INR11,000cr GDV of launches across three quarters and the path from INR400bn to over INR500bn of GDV. · Open →
Q3 & 9M FY2025 Earnings Conference Call — Q3 FY2025 · 9 pages · A mid-year FY25 check on the 30%+ pre-sales run-rate and the BKC/luxury momentum that was then driving the mix. · Open →
Q2 & H1 FY2025 Earnings Conference Call — Q2 FY2025 · 9 pages · H1 FY25 progress on the GDV-doubling roadmap and the cash-flow surplus that funds business development. · Open →
Q1 FY2025 Earnings Conference Call — Q1 FY2025 · 9 pages · The opening quarter of FY25, for the first read on the 30-35% pre-sales guidance and the year's launch pipeline. · Open →
Q3 & 9M FY2024 Earnings Conference Call — Q3 FY2024 · 12 pages · 9M FY24 update on the net-debt-zero balance sheet and the pickup in BKC luxury inventory. · Open →
Q2 & H1 FY2024 Earnings Conference Call — Q2 FY2024 · 8 pages · H1 FY24 view of the sustenance-plus-new-launch model and continued cash-flow discipline. · Open →
Sunteck Realty Limited's annual reports contain management's most considered account of the business. These are the sections, passages and visual pages worth opening in the originals preserved in Sources.
Sunteck Realty Limited — FY2025 Annual Report (42nd AGM) — FY2025
Latest report: captures the pivot to Uber Luxury, Dubai activation, record pre-sales and a net-cash balance sheet. · Open the full document →
About Us — p. 40 · Read the full section →
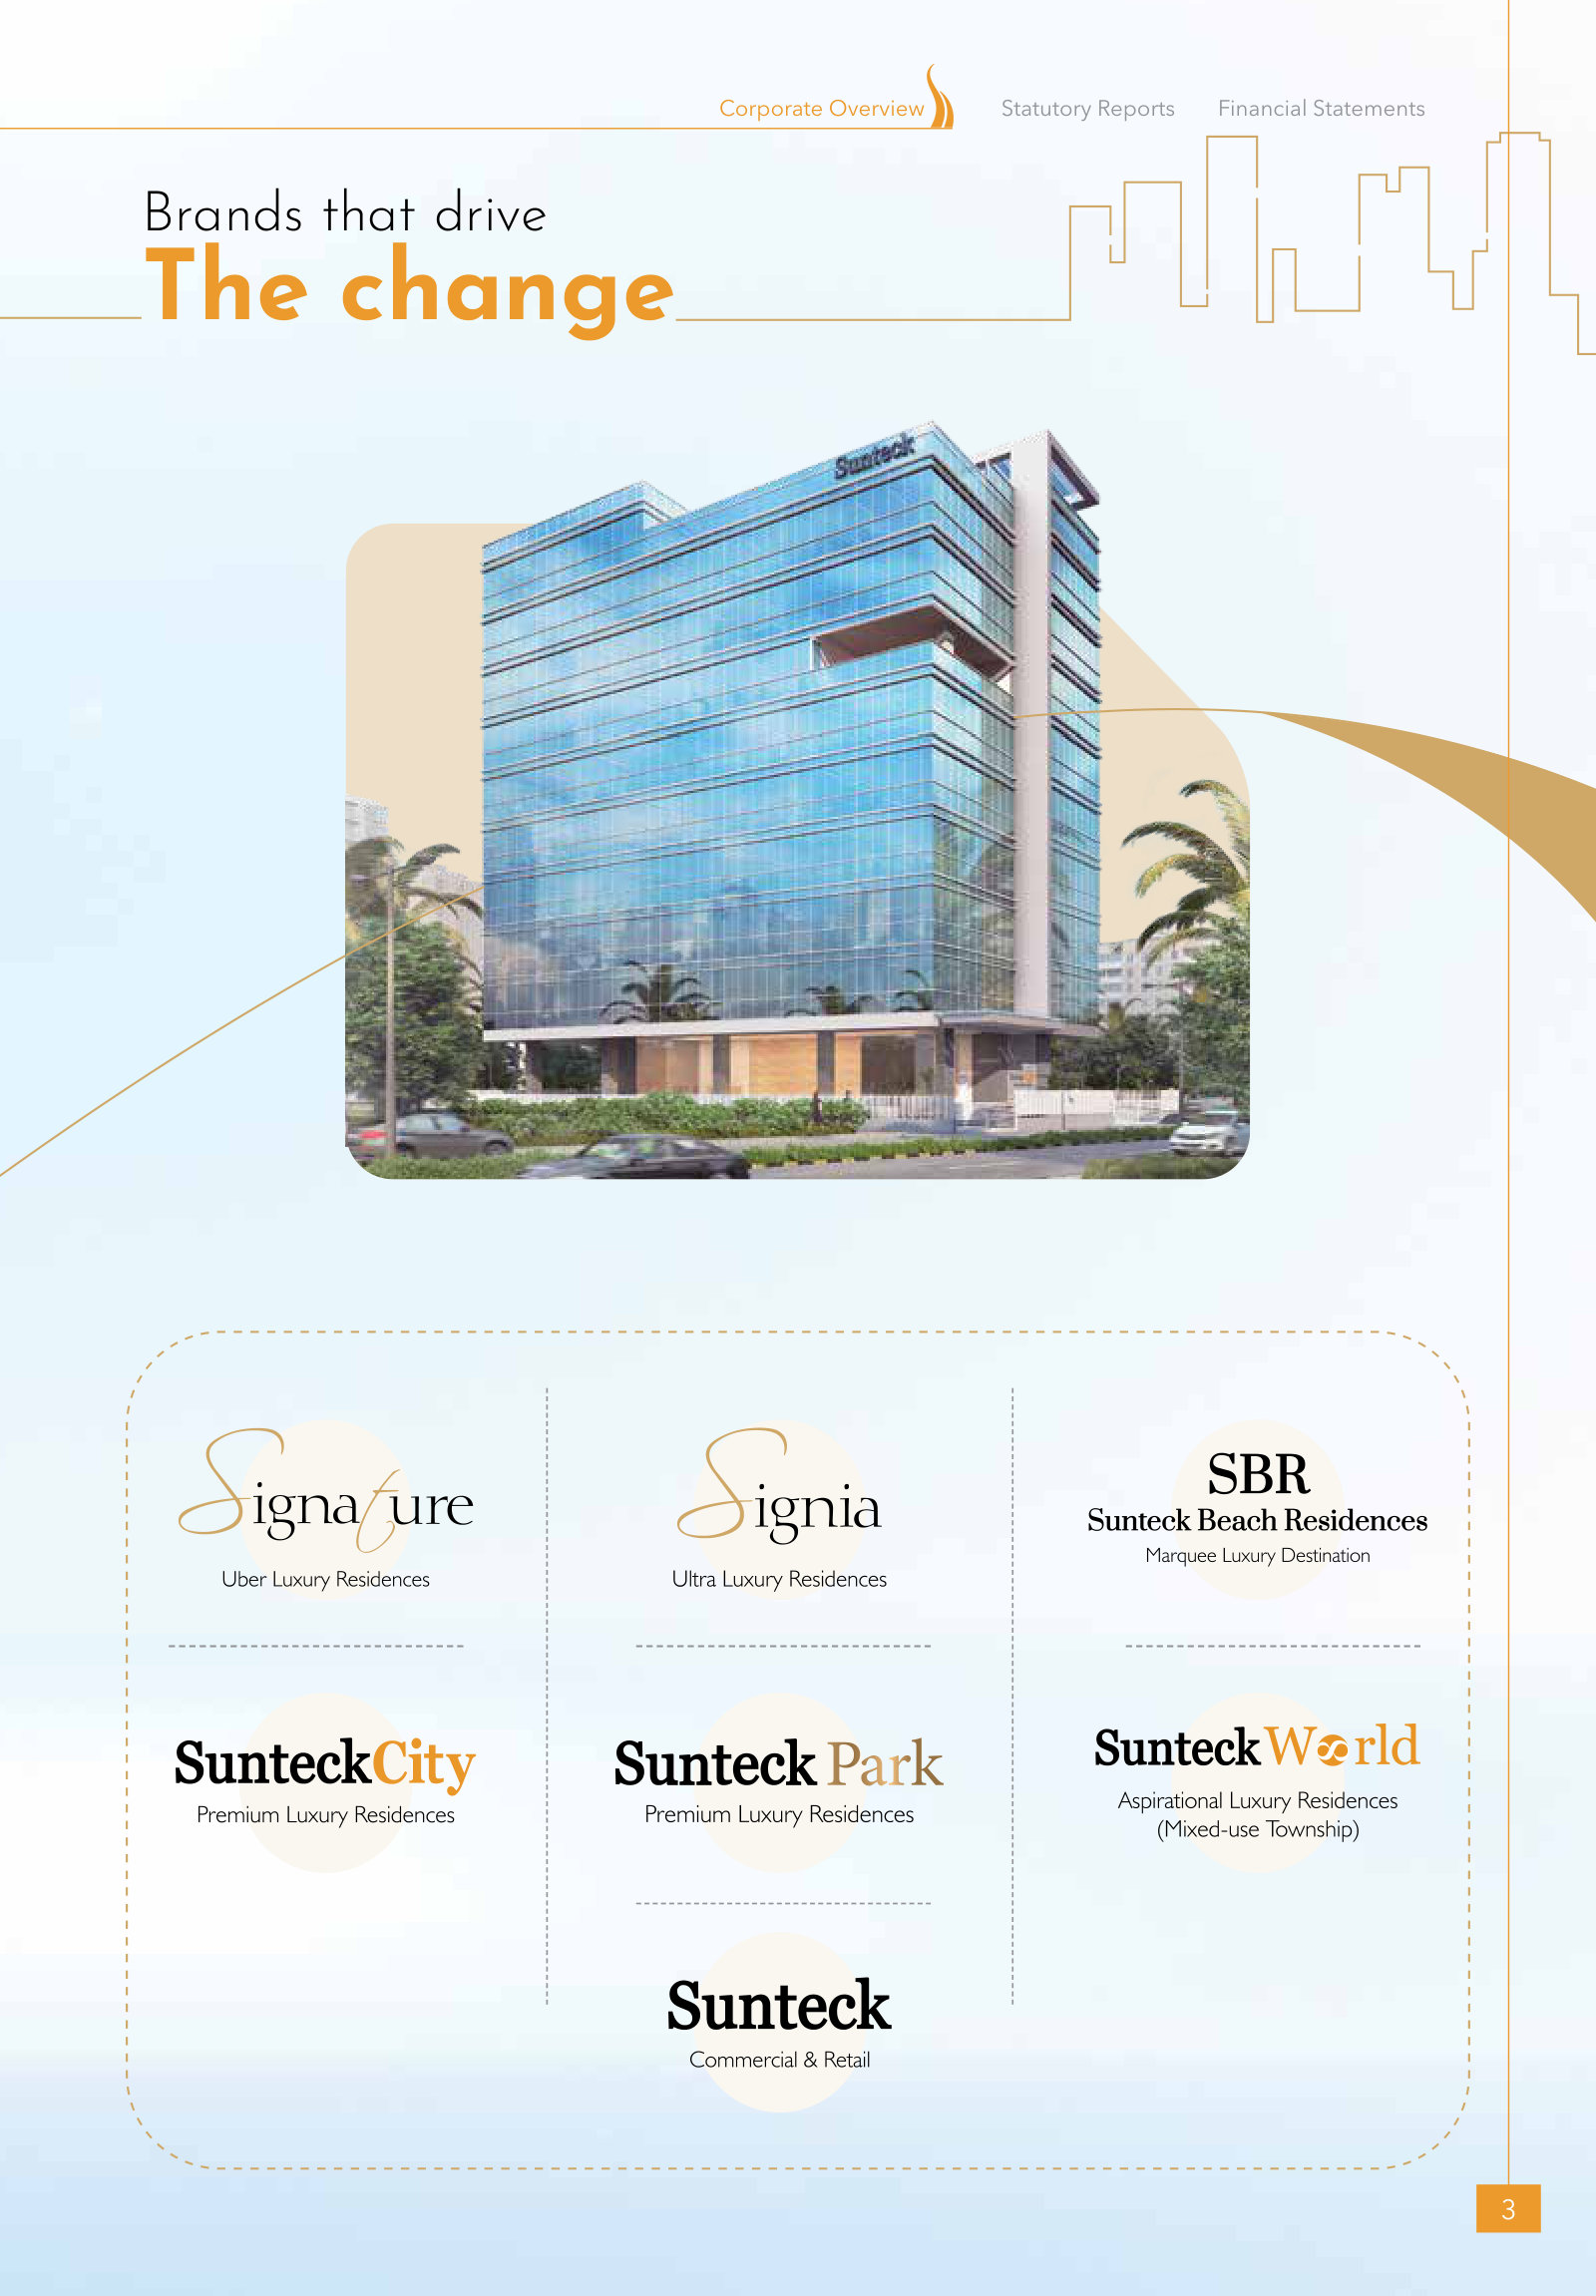
The business in one page — MMR-focused developer, net-zero debt, 50m sq ft across 32 projects, five luxury tiers.
How management defines the company: fastest-growing MMR developer with a net-zero-debt balance sheet.
Sunteck Realty Limited (Sunteck) is the fastest-growing Mumbai-based real estate development company. […] Sunteck holds one of the strongest balance sheets with net-zero debt levels & robust cash flows. […] Sunteck focusses on a city-centric development portfolio of over 50 million sq. ft. spread across 32 projects. […] Sunteck’s presence across the spectrum is differentiated by Uber Luxury, Ultra Luxury, Premium Luxury, Marquee Luxury & Aspirational Luxury segments.
p. 40 · Read in context →
CMD's Message — p. 42 · Read the full section →
Chairman Kamal Khetan frames the year: record pre-sales, net-cash position, and the new Dubai and South Mumbai growth engines.
Record ₹2,531 cr pre-sales, net-cash surplus with AA rating, and the Dubai Downtown activation.
We closed the year with our highest-ever annual presales of \
2,531 crore, a 32% year-on-year growth. \[…] With a net debt-to-equity of minus 0.04x, we remain in a net cash position with \\125 crore of surplus, supported by a reafirmed AA (Stable) credit rating by Fitch (India Ratings). […] FY2025 marked a transformative year for Sunteck Realty, with the strategic activation of our Dubai, project investment in the prestigious Dubai Downtown, Burj Khalifa community near Dubai Mall.
p. 43 · Read in context →
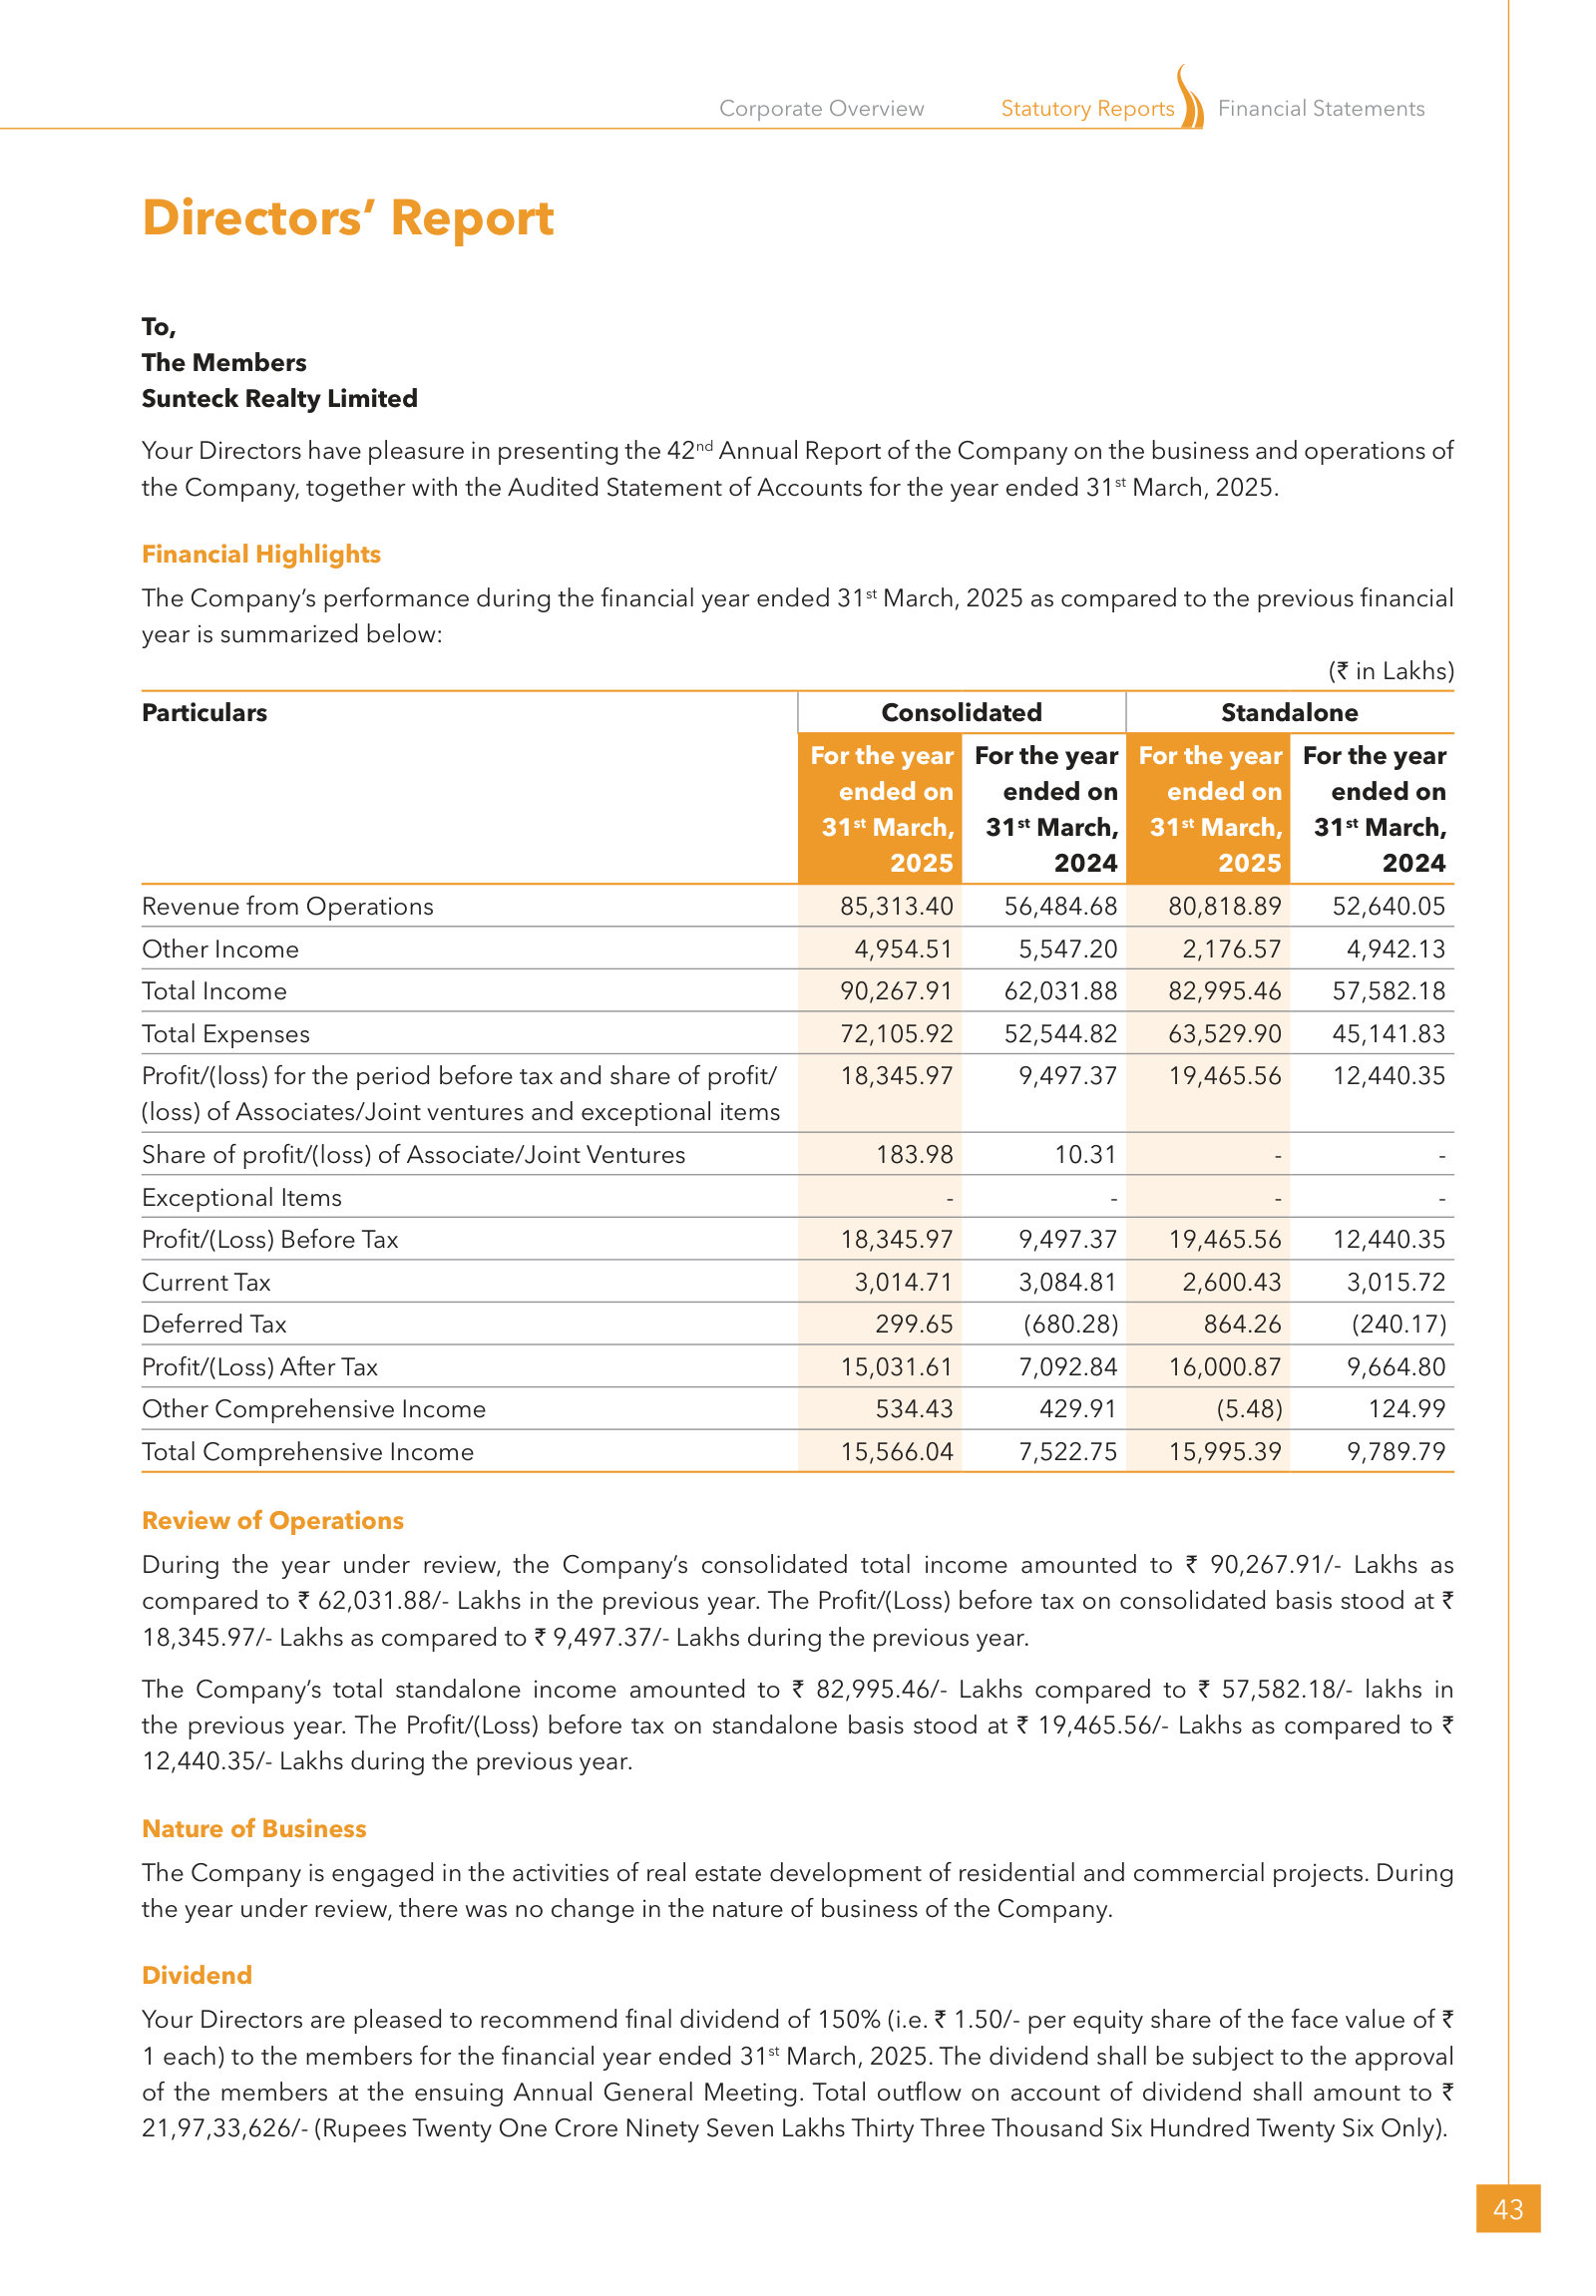
Directors' Report — Financial Highlights and Review of Operations — p. 81 · Read the full section →
The audited numbers side by side: consolidated and standalone P&L for FY25 versus FY24.
Management Discussion and Analysis — p. 173 · Read the full section →
Where management explains the model — the deliberate shift to ultra-premium and the GDV and pre-sales build-up FY22–FY25.
Business Overview: the strategic tilt to Uber Luxury, asset-light JDAs and margin-gated land buys.
Sunteck Realty remains steadfast in its commitment to best product delivery which continue to be at the core of its business philosophy. Over the past years, the company has strategically shifted its portfolio towards the ultrapremium Uber Luxury segment, reflecting its aspiration to establish a leadership position in the luxury real estate market. Its business development strategy is diversified and flexible, encompassing redevelopment projects, strategic land acquisitions, and combination of an asset-light model. However, every opportunity is carefully evaluated against stringent margin thresholds to ensure financial discipline. The company applies segment-specific risk-return priorities to maintain profitability across all categories.
p. 175 · Read in context →
GDV nearly tripled to ₹39,370 cr and pre-sales rose to ₹2,531 cr over FY22–FY25.
Over the four years, the company’s GDV has grown significantly from approximately INR 13,650 crores in FY22 to INR 26,645 crores in FY24, before surging towards an remarkable INR 39,370 crores in FY25. […] Pre-sales rose from around INR 1,303 crore in FY22 to INR 1,602 crore in FY23, further growing to INR 1,915 crore in FY24, and achieving a substantial jump to INR 2,531 crore in FY25.
p. 176 · Read in context →
Key Audit Matters (Independent Auditor's Report) — p. 183 · Read the full section →
The auditor's own flags — the two estimates that most drive Sunteck's reported profit: revenue timing and inventory value.
KAM 2 — inventory carried at lower of cost and NRV, an estimate sensitive to selling prices and costs to complete.
Inventory is valued at cost and net realisable value (NRV), whichever is less.NRV is the estimated selling price in the ordinary course of business, less estimated costs necessary to make the sale and estimated costs of completion (in case of construction work-in- progress).
p. 185 · Read in context →
Note 2 — Material Accounting Policy Information: Revenue Recognition — p. 206 · Read the full section →
The accounting policy that defines a developer's earnings — when a sale becomes revenue, over time or on completion.
Point-in-time (completed-contract) vs over-time POC input method for recognizing project revenue.
For performance obligations where any one of the above conditions are not met, revenue is recognized at the point in time (completed contract basis) at which the performance obligation is satisfied. […] In respect of ‘over the period of time’, the revenue is recognized based on the percentage-of-completion method (‘POC method’) of accounting with cost of project incurred (input method) for the respective projects determining the degree of completion of the performance obligation.
p. 207 · Read in context →
Sunteck Realty Limited — FY2021 Annual Report (38th AGM) — FY2021
Older edition included to show the strategy arc: the 'Sunteck 3.0' asset-light, debt-reduction reset that preceded today's Uber Luxury push. · Open the full document →
CMD's Message — p. 24 · Read the full section →
The 'Sunteck 3.0' pivot in the CMD's words — asset-light, sell down finished inventory, cut debt to negligible levels.
FY2021 reset: asset-light balance sheet, selling ~₹1,800 cr of finished inventory, JDA focus and muted debt levels.
I am extremely glad to introduce the next leg of our Sunteck journey, what I humbly call Sunteck 3.0. […] As we embark on our new journey, we aim to maintain an asset light balance sheet by selling off most of our INR 1,800 crores of finished inventory in the next 3-4 years. Focussing on JDA’s like Naigaon, Vasai, Vasind and Borivali with low capex requirements, we wish to acquire land only if the opportunity is extremely compelling and helps us maintain muted debt-levels.
p. 24 · Read in context →
More annual reports
Sunteck Realty Limited — FY2024 Annual Report (41st AGM) — FY2024 · 387 pages · Prior year: the base against which FY25's revenue and profit step-up is measured. · Open →
Sunteck Realty Limited — FY2023 Annual Report (40th AGM) — FY2023 · 345 pages · Start of the FY23–FY25 completed-project revenue recognition ramp. · Open →
Sunteck Realty Limited — FY2022 Annual Report (39th AGM) — FY2022 · 317 pages · Bridge year between the Sunteck 3.0 reset and the luxury-led growth phase. · Open →
Competitors describe Sunteck Realty Limited's market in their own filings and calls. These verified passages and visual pages show where their strategies meet, using source documents preserved in Sources.
Macrotech Developers (Lodha) (LODHA)
The largest residential developer in the Mumbai Metropolitan Region and Sunteck's biggest direct competitor for MMR land, premium buyers and township-scale supply. Its own market-share and micro-market claims frame the fragmented pool Sunteck sells into.
Lodha's own read of its scale: even as the region's largest developer it puts its share of primary housing sales across India's top six cities at only ~3.5% — its case for a long consolidation runway in the fragmented market Sunteck also competes in.
Abhishek Lodha, Managing Director & CEO: The one other number that I want to highlight is market share. Despite all the growth that we've had, we are currently at about 3.5% of primary housing sales in the top 6 cities.
p. 4 · Read in context →
A competitor's sizing of the shared market: Lodha estimates the Mumbai housing market at roughly INR235,000 crore by the end of the decade — the MMR revenue pool within which Sunteck operates.
Abhishek Lodha, Managing Director & CEO: For example, the scale of the housing market in Mumbai by the end of the decade, will be roughly about INR235,000 crores and we expect sales in Palava and Upper Thane by the end of the decade to be in the range of about INR8,000 crores. So it's about a 3.5% market share of the larger Mumbai market that we expect Palava and Upper Thane to have.
p. 22 · Read in context →
Lodha's stated position in the ultra-premium South & Central Mumbai segment — the same high-end residential band Sunteck targets with Signature Island and Signia — where it claims outright category leadership.
Nishant Bhasin, Deputy CEO – Luxury: we have made significant strides in South & Central market over the past few years, scaling from a relatively limited presence in INR100 crores plus segment to becoming the leading player by sales in the region with a growth trajectory of 30% CAGR since financial year '23. […] this segment continues to be a key strength for us, where we command a 40% market share in INR100 crores plus category today.
p. 8 · Read in context →
Oberoi Realty (OBEROIRLTY)
The closest positioning comparator to Sunteck — a premium/luxury Mumbai developer built on brand equity, design and mixed-use annuity assets, competing in the same MMR micro-markets for the same high-net-worth buyers.
Oberoi's stated view of the sector's size and its own segment: a US-dollar-trillion India real-estate market by 2030, with luxury residential described as leading the way — the premium band Sunteck also plays in.
Vikas Oberoi, Chairman & Managing Director: The real estate sector in India is expected to reach US$ 1 trillion in market size by 2030, up from US$ 200 billion in 2021. […] The residential sector has seen exceptional strength, with the luxury segment leading the way.
p. 6 · Read in context →
Oberoi ties the premiumisation thesis specifically to Mumbai — Sunteck's core market — arguing infrastructure and end-user demand entrench luxury real estate there.
Vikas Oberoi, Chairman & Managing Director: In markets like Mumbai, this trend is further reinforced by strong end-user demand, infrastructure-led growth, and a stable macroeconomic backdrop – firmly positioning luxury real estate as both a lifestyle choice and a long-term value proposition.
p. 6 · Read in context →
Quantified pipeline expansion into the same geography: Oberoi reports adding close to 4 million sq ft of development potential across MMR micro-markets in FY2026, competing directly for the land and redevelopment Sunteck also pursues.
Vikas Oberoi, Chairman & Managing Director: On the business development front, the year was marked by strong momentum and strategic expansion, with the Company adding close to 4 million square feet of development potential across key micro-markets in the Mumbai Metropolitan Region.
p. 7 · Read in context →
Keystone Realtors (Rustomjee) (RUSTOMJEE)
A same-scale, MMR-focused peer built on the same asset-light / joint-development and redevelopment model Sunteck espouses — the most like-for-like direct competitor in Sunteck's core Mumbai suburbs.
Rustomjee quantifies its own MMR share and pre-sales trajectory — an explicit claim of gaining ground in the exact market Sunteck competes in.
Boman Irani, Chairman & Managing Director: You remember, we were at INR1,604 crores in FY '23. And today, we are at INR4,022 crores in FY '26. That is a CAGR of 36%. Our market share in the MMR has doubled. We are at approximately 2% of the market of MMR in the last 3 years now.
p. 4 · Read in context →
Rustomjee describes the capital-light redevelopment playbook — capping upfront equity at 10% of project GDV — that mirrors Sunteck's own stated asset-light, JDA-led strategy.
Boman Irani, Chairman & Managing Director: This reflects the effectiveness of our asset-light capital-efficient model and our continuous focus on redevelopment within Mumbai MMR area. Financially, we continue to maintain strict thresholds with upfront equity capital limited to 10% of total project GDV up to launch.
p. 4 · Read in context →
Rustomjee's annual-report sizing of the shared market: MMR absorption of roughly 96,187 units, a competitor's read of the demand pool Sunteck sells into.
MMR achieved residential sales of approximately 96,187 units in 2025, representing an 11% year-on-year increase and underscoring sustained buyer confidence.
p. 35 · Read in context →
Godrej Properties (GODREJPROP)
India's largest residential developer by bookings and a major MMR competitor whose scale-and-consolidation narrative frames the structural pressure on smaller premium players like Sunteck.
Godrej's stated consolidation thesis — a fragmented sector concentrating toward a few dominant developers per region — the structural risk backdrop for smaller MMR players such as Sunteck.
The Indian real estate sector, characterised by its highly fragmented nature, has been undergoing a significant phase of consolidation for several years. This consolidation has been accelerated by various factors, including the pandemic, which has effectively sidelined less robust participants. […] With the trend leaning towards a smaller number of dominant developers in each region, this period of consolidation offers an attractive chance for current real estate firms to meet the increasing demand for housing.
p. 107 · Read in context →
Godrej's MD flags premium and luxury housing as its strongest-momentum segment — the same high-end demand Sunteck's brands are built on — backed by a large forward booking pipeline.
Gaurav Pandey, Managing Director & CEO: We continue to see particularly strong momentum in the premium and luxury housing segments, driven by rising aspirations and wealth creation, while mid-income housing demand remains steady and structurally supported. During the reporting year, we added projects with an estimated future booking value of ₹42,100 crore, giving us strong visibility on future growth.
p. 33 · Read in context →
Ajmera Realty & Infra India (AJMERA)
A Mumbai-based mid-cap of comparable scale to Sunteck, pursuing the same asset-light redevelopment route into overlapping premium MMR micro-markets — the closest size-and-geography peer.
Ajmera sizes MMR at roughly 30% of India's real-estate volume and argues its brand commands a pricing premium over nearby supply — the same premium-positioning contest Sunteck is in.
Dhaval Ajmera, Director – Corporate Affairs: Overall, the real estate volume of all across India, MMR contributes to about 30-odd percent across India. […] we are able to command pricing 20% to 30% higher than what we have been actually selling today.
p. 12 · Read in context →
Ajmera frames Mumbai redevelopment as the dominant new-supply source and argues societies are turning selective toward established developers — the redevelopment-driven competition Sunteck also navigates.
Dhaval Ajmera, Director – Corporate Affairs: In our core micro market, which is the market of Mumbai, redevelopment has emerged as a primary source of new supply. […] today, more than about 50% to 60% of the city's housing stock is coming through this. And I would just call this as the “Great Redevelopment Wave”, which is just reshaping the urban fabric. […] now we are slowly and very steadily seeing that selection of developers towards the society and society's selection towards the developers has now started to become very, very selective.
p. 3 · Read in context →
Kolte-Patil Developers (KOLTEPATIL)
A Pune-anchored, Blackstone-backed developer actively pushing into the MMR redevelopment market — a newer entrant into Sunteck's core territory whose own market read and Mumbai launches signal the collision.
Kolte-Patil's annual-report market read: MMR remains India's largest residential market by units — a competitor's framing of why it is expanding into Sunteck's home turf.
Despite the slowdown, during Q1 2026, Mumbai Metropolitan Region (MMR) remained the country’s largest residential market, accounting for 23,185 units sold during Q1 2026. Bengaluru ranked second with 13,092 units, followed by NCR (12,734 units) and Pune (12,711 units).
p. 49 · Read in context →
Concrete evidence of the Pune developer's MMR push: a Versova redevelopment project moving to launch, extending Kolte-Patil into the western-suburb micro-markets where Sunteck operates.
Atul Bohra, Group CEO: At Mumbai, Laxmi Ratan project at Versova is set to launch in quarter 2. We have already finished the demolition work and secured most of the sanction. What is awaiting is commencement certificate and the RERA approval. Post that, we are good to go.
p. 7 · Read in context →
More peer documents
Lodha Q1 FY2026 earnings call — 19 pages · Palava/Upper Thane premiumisation commentary (5 crore-plus villas; premium mix rising toward 50% by decade-end) shows the largest peer pushing up-market into Sunteck's segment. · Open →
Godrej Properties Q3 FY2026 earnings call — 16 pages · Management quantifies market-share doubling from 2.4% (CY21) to 4.8% (CY25) and consecutive No.1 ranking — the clearest statement of national consolidation pressure. · Open →
Rustomjee Q2 FY2026 earnings call — 14 pages · Cluster-redevelopment pipeline detail (GTB Nagar, Lokhandwala, Malad West, Dindoshi totalling ~INR11,550 crore GDV) maps a direct MMR peer's project-level footprint. · Open →
Kolte-Patil FY2025 annual report — 345 pages · Market-context section frames Mumbai as India's premier luxury destination (INR20–50 crore segment leadership), useful third-party sizing of Sunteck's premium band. · Open →
Ajmera Realty Q2 FY2026 earnings call — 17 pages · Highest-ever quarterly bookings (~INR828 crore) and 5x-growth strategy detail quantify a same-size Mumbai peer's momentum. · Open →
Macrotech (Lodha) FY2026 annual report — 315 pages · Full strategic narrative on top-6-city share, luxury market-share and premiumisation from the region's dominant developer. · Open →
Source: S&P Capital IQ consensus via Xpressfeed · Generated 2026-07-21.
Street snapshot
The mean price target is ₹517 (median ₹516), spanning a low of ₹425 to a high of ₹610.
Currency: INR · Scale: money in millions, absolute (per share) · Analyst counts shown explicitly; recommendation respondents: 12.
| Street view | Reading | Analysts |
|---|---|---|
| Recommendation mix | Buy 11, Outperform 1, Hold 0, Underperform 0, Sell 0 | 12 |
| Consensus score | 1.08 | 12 |
| Target price | mean 516.8; high 610.0; low 425.0 | 12 |
Forward table
Consensus models steady growth, with revenue rising from ₹12,098 in FY2026 to ₹14,954 (FY2027) and ₹17,621 (FY2028), and normalized EPS advancing from 16.31 to 18.98 to 22.49. Gross margin is held near 49% across the horizon.
Currency: INR · Scale: money in millions, absolute (per share) · Analyst count is the estimate count for each period and metric.
| Period | Metric | Mean | YoY | Analysts | Low / high |
|---|---|---|---|---|---|
| FY0E | Revenue | 14,954 | 33.1% | 11 | 13,190 / 18,586 |
| FY0E | EBITDA | 3,704 | 21.5% | 8 | 3,485 / 3,973 |
| FY0E | EBIT | 3,580 | 18.7% | — | — / — |
| FY0E | Net income (GAAP) | 2,846 | 39.3% | 10 | 2,490 / 3,693 |
| FY0E | Net income (normalized) | 2,846 | 25.7% | — | — / — |
| FY0E | EPS (GAAP) | 18.93 | 35.8% | 11 | 16.57 / 25.20 |
| FY0E | EPS (normalized) | 18.98 | 36.2% | 11 | 16.60 / 25.20 |
| FY0E | Free cash flow | 5,084 | 72.0% | — | — / — |
| FY0E | Dividend per share | 1.50 | -3.6% | — | — / — |
| FY0E | Gross margin | 49.4% | 1.4% | — | — / — |
| FY0E | Capital expenditure | -305.3 | 37.1% | — | — / — |
| FY0E | Net debt | 1,224 | -60.9% | — | — / — |
| FY0E | ROE | 7.7% | 20.8% | — | — / — |
| FY0E | Cash from operations | 3,544 | 80.7% | — | — / — |
| FY+1E | Revenue | 17,621 | 17.8% | 11 | 14,758 / 21,223 |
| FY+1E | EBITDA | 4,768 | 28.7% | 12 | 3,267 / 6,994 |
| FY+1E | EBIT | 4,576 | 27.8% | — | — / — |
| FY+1E | Net income (GAAP) | 3,317 | 16.6% | 12 | 2,460 / 4,650 |
| FY+1E | Net income (normalized) | 3,321 | 16.7% | — | — / — |
| FY+1E | EPS (GAAP) | 22.45 | 18.6% | 12 | 16.80 / 33.00 |
| FY+1E | EPS (normalized) | 22.49 | 18.5% | 12 | 16.80 / 33.45 |
| FY+1E | Free cash flow | -156.5 | -103.1% | — | — / — |
| FY+1E | Dividend per share | 1.50 | 0.3% | — | — / — |
| FY+1E | Gross margin | 49.5% | 0.3% | — | — / — |
| FY+1E | Capital expenditure | -432.2 | 41.6% | — | — / — |
| FY+1E | Net debt | 1,834 | 49.9% | — | — / — |
| FY+1E | Cash from operations | 2,931 | -17.3% | — | — / — |
| FY+1E | ROE | 8.1% | 5.0% | — | — / — |
| FY+2E | Revenue | 25,197 | 43.0% | 5 | 19,448 / 35,745 |
| FY+2E | EBITDA | 7,164 | 50.3% | 5 | 3,268 / 11,553 |
| FY+2E | EBIT | 6,819 | 49.0% | — | — / — |
| FY+2E | Net income (GAAP) | 5,056 | 52.4% | 5 | 2,550 / 7,915 |
| FY+2E | Net income (normalized) | 5,056 | 52.3% | — | — / — |
| FY+2E | EPS (GAAP) | 34.62 | 54.2% | 5 | 16.10 / 56.00 |
| FY+2E | EPS (normalized) | 34.62 | 54.0% | 5 | 16.10 / 56.00 |
| FY+2E | Free cash flow | 1,406 | -998.4% | — | — / — |
| FY+2E | Dividend per share | 3.05 | 102.7% | — | — / — |
| FY+2E | Gross margin | 48.8% | -1.6% | — | — / — |
| FY+2E | Capital expenditure | -1,365 | 215.7% | — | — / — |
| FY+2E | Net debt | 121.0 | -93.4% | — | — / — |
| FY+2E | Cash from operations | 2,357 | -19.6% | — | — / — |
| FY+2E | ROE | 11.1% | 37.8% | — | — / — |
| Q2 FY2027 | Revenue | 3,296 | 30.6% | 1 | 3,296 / 3,296 |
| Q2 FY2027 | EBITDA | 861.0 | 10.6% | 1 | 861.0 / 861.0 |
| Q2 FY2027 | EBIT | 820.0 | 17.8% | — | — / — |
| Q2 FY2027 | Net income (GAAP) | 562.0 | 14.8% | 1 | 562.0 / 562.0 |
| Q2 FY2027 | Net income (normalized) | 562.0 | 10.6% | — | — / — |
| Q2 FY2027 | EPS (GAAP) | 3.80 | 13.8% | 1 | 3.80 / 3.80 |
| Q2 FY2027 | EPS (normalized) | 3.80 | 13.8% | 1 | 3.80 / 3.80 |
| Q2 FY2027 | Gross margin | 50.5% | — | — | — / — |
| Q3 FY2027 | Revenue | 3,726 | 8.3% | 1 | 3,726 / 3,726 |
| Q3 FY2027 | EBITDA | 1,048 | 28.6% | 1 | 1,048 / 1,048 |
| Q3 FY2027 | EBIT | 1,005 | 12.8% | — | — / — |
| Q3 FY2027 | Net income (GAAP) | 708.0 | 21.6% | 1 | 708.0 / 708.0 |
| Q3 FY2027 | Net income (normalized) | 708.0 | 22.8% | — | — / — |
| Q3 FY2027 | EPS (GAAP) | 4.80 | 20.9% | 1 | 4.80 / 4.80 |
| Q3 FY2027 | EPS (normalized) | 4.80 | 20.9% | 1 | 4.80 / 4.80 |
| Q3 FY2027 | Gross margin | 50.5% | 8.1% | — | — / — |
| Q4 FY2027 | Revenue | 4,442 | 31.0% | 1 | 4,442 / 4,442 |
| Q4 FY2027 | EBITDA | 1,372 | 41.9% | 1 | 1,372 / 1,372 |
| Q4 FY2027 | EBIT | 1,328 | 30.9% | — | — / — |
| Q4 FY2027 | Net income (GAAP) | 949.0 | 48.9% | 1 | 949.0 / 949.0 |
| Q4 FY2027 | Net income (normalized) | 949.0 | 35.1% | — | — / — |
| Q4 FY2027 | EPS (GAAP) | 6.50 | 49.8% | 1 | 6.50 / 6.50 |
| Q4 FY2027 | EPS (normalized) | 6.50 | 49.8% | 1 | 6.50 / 6.50 |
| Q4 FY2027 | Gross margin | 50.5% | 15.0% | — | — / — |
Estimate momentum
Recent revisions lean lower on both metrics and both years: FY2027 normalized EPS has slipped from 20.77 (180 days ago) to 18.98, and FY2027 revenue from 17,955 (90 days ago) to 14,954. FY2028 moves the same way, with normalized EPS easing from 25.84 to 22.49.
Currency: INR · Scale: money in millions, absolute (per share) · Point-in-time consensus; analyst count is shown where supplied.
| Period | Metric | Lookback | Then | Now | Direction / magnitude | Analysts |
|---|---|---|---|---|---|---|
| 2027 | EPS (normalized) | 30d | 18.98 | 18.98 | flat 0.0% | — |
| 2027 | EPS (normalized) | 90d | 26.60 | 18.98 | down 28.6% | — |
| 2027 | EPS (normalized) | 180d | 20.77 | 18.98 | down 8.6% | — |
| 2027 | Revenue | 30d | 14,954 | 14,954 | flat 0.0% | — |
| 2027 | Revenue | 90d | 17,955 | 14,954 | down 16.7% | — |
| 2027 | Revenue | 180d | 15,880 | 14,954 | down 5.8% | — |
| 2028 | Revenue | 30d | 17,621 | 17,621 | flat 0.0% | — |
| 2028 | Revenue | 90d | 19,220 | 17,621 | down 8.3% | — |
| 2028 | Revenue | 180d | 19,319 | 17,621 | down 8.8% | — |
| 2028 | EPS (normalized) | 30d | 22.49 | 22.49 | flat 0.0% | — |
| 2028 | EPS (normalized) | 90d | 26.76 | 22.49 | down 16.0% | — |
| 2028 | EPS (normalized) | 180d | 25.84 | 22.49 | down 13.0% | — |
Beat / miss record
Current sequences by metric: Revenue: 2 consecutive misses; EPS (normalized): 1 consecutive beat.
Currency: INR · Scale: money in millions, absolute (per share) · Consensus is captured before each actual first became effective; analyst count shown per observation.
| Quarter | Metric | Consensus as of | Actual | Surprise | Outcome | Analysts |
|---|---|---|---|---|---|---|
| Q1 FY2027 | Revenue | 2,788 | 1,916 | -31.3% | Miss | — |
| Q1 FY2027 | EPS (normalized) | 2.80 | 2.88 | 2.9% | Beat | — |
| Q4 FY2026 | Revenue | 4,059 | 3,390 | -16.5% | Miss | — |
| Q4 FY2026 | EPS (normalized) | 5.40 | 4.34 | -19.6% | Miss | — |
| Q3 FY2026 | Revenue | 2,981 | 3,441 | 15.4% | Beat | — |
| Q3 FY2026 | EPS (normalized) | 4.15 | 3.97 | -4.3% | Miss | — |
| Q2 FY2026 | Revenue | 2,517 | 2,524 | 0.3% | Beat | — |
| Q2 FY2026 | EPS (normalized) | 3.75 | 3.34 | -10.9% | Miss | — |
| Q1 FY2026 | Revenue | 2,860 | 1,883 | -34.2% | Miss | — |
| Q4 FY2025 | Revenue | 4,551 | 2,060 | -54.7% | Miss | — |
| Q4 FY2025 | EPS (normalized) | 5.30 | 3.44 | -35.1% | Miss | — |
| Q3 FY2025 | Revenue | 1,972 | 1,618 | -18.0% | Miss | — |
| Q2 FY2025 | Revenue | 3,141 | 1,690 | -46.2% | Miss | — |
| Q2 FY2025 | EPS (normalized) | 3.20 | 2.36 | -26.2% | Miss | — |
Where the street disagrees
Disagreement widens sharply in the outer years, where coverage thins: FY2029 revenue spans ₹19,448 to ₹35,745 on just 5 estimates, and FY2029 normalized EPS ranges 16.1 to 56.
Currency: INR · Scale: money in millions, absolute (per share) · Dispersion is high-low divided by absolute mean; analyst count shown per item.
| Period | Metric | Mean | Low | High | Spread / mean | Analysts |
|---|---|---|---|---|---|---|
| 2029 | EBITDA | 7,164 | 3,268 | 11,553 | 115.6% | 5 |
| 2029 | EPS (GAAP) | 34.62 | 16.10 | 56.00 | 115.3% | 5 |
| 2029 | EPS (normalized) | 34.62 | 16.10 | 56.00 | 115.3% | 5 |
| 2029 | Net income (GAAP) | 5,056 | 2,550 | 7,915 | 106.1% | 5 |
| Q3 FY2025 | Revenue | 1,972 | 942.0 | 3,002 | 104.5% | 2 |
Source: Visible Alpha consensus via S&P Xpressfeed · Consensus as of 2026-07-08 · generated 2026-07-21.
Model trust
Five contributors is a workable but modest panel, and coverage thins sharply below the headline lines, where many drivers sit at just one to three brokers.
Base currency: INR · VA scales normalized from Abs, M; item currencies and units retained · Coverage depth and vintage; broker count is the maximum represented.
| Brokers | Line items | Last revision |
|---|---|---|
| 5 | 349 | 2026-07-08 |
Operating KPIs
The company-specific operating detail is fragmented across dozens of project-level lines — area sold in square feet and cash collections — most carried by only one to three brokers, so no single operating driver reads as consensus. The consolidated revenue line (three to five brokers) is the more reliable gauge, with EBITDA margin modeled to widen from 26.8% in FY2026 to 29.5% by FY2028.
Base currency: INR · VA scales normalized from Abs, M; item currencies and units retained · FY-1A / FY0E / FY+1E; broker count shown per KPI.
| Operating KPI | Source | FY-1A | FY0E | FY+1E | Brokers |
|---|---|---|---|---|---|
| Cash and cash equivalents, net | CD | — | 4,400,216.03bn Amount | 4,217,771.43bn Amount | 5 |
| Cost of revenue | CD | — | 5,859,629.66bn Amount | 7,087,335.15bn Amount | 5 |
| Depreciation and amortisation expense | CD | — | 147,284.93bn Amount | 167,141.01bn Amount | 5 |
| Employee benefits expense | CD | — | 1,150,954.71bn Amount | 1,440,967.86bn Amount | 5 |
| Finance costs | CD | — | -674,542.91bn Amount | -713,899.40bn Amount | 5 |
| Inventories | CD | — | 60,096,234.20bn Amount | 81,035,980.70bn Amount | 5 |
| Other expenses | CD | — | 1,535,291.35bn Amount | 1,581,673.31bn Amount | 5 |
| Other income | CD | — | 471,814.77bn Amount | 482,784.46bn Amount | 5 |
| Profit/(loss) before tax | CD | — | 2,782,716.88bn Amount | 3,717,807.19bn Amount | 5 |
| Profit/(loss) before tax and share of profit(loss) of joint venture | CD | — | 2,777,367.38bn Amount | 3,717,437.19bn Amount | 5 |
| Profit/(loss) for the period year | CD | — | 2,012,640.25bn Amount | 2,751,494.28bn Amount | 5 |
| Revenue from operations | CD | — | 11,673,256.17bn Amount | 14,225,669.46bn Amount | 5 |
P&L bridge
Base currency: INR · VA scales normalized from Abs, M; item currencies and units retained · Margins are derived against revenue; YoY compares adjacent fiscal columns; broker count shown per line.
| P&L line | FY-1A | FY0E | FY+1E | Brokers |
|---|---|---|---|---|
| Revenue | — | 11,673,256.17bn Amount | 14,225,669.46bn Amount (21.9% YoY) | 5 |
| Gross Profit | — | 5,813,626.51bn Amount (49.8% margin) | 7,138,334.31bn Amount (50.2% margin; 22.8% YoY) | 5 |
| Ebitda | — | 3,127,380.45bn Amount (26.8% margin) | 4,115,693.13bn Amount (28.9% margin; 31.6% YoY) | 5 |
| Operating Income | — | 2,980,095.52bn Amount (25.5% margin) | 3,948,552.13bn Amount (27.8% margin; 32.5% YoY) | 5 |
| Net Income | — | 2,012,640.25bn Amount (17.2% margin) | 2,751,494.28bn Amount (19.3% margin; 36.7% YoY) | 5 |
| Eps | — | 14.82 Amount | 18.69 Amount (26.1% YoY) | 5 |
Consensus dispersion
Base currency: INR · VA scales normalized from Abs, M; item currencies and units retained · Top high-low spreads relative to absolute mean; requires at least 3 brokers.
| Line item | Period | Mean | Min | Q1 | Q3 | Max | Spread / mean | Brokers |
|---|---|---|---|---|---|---|---|---|
| Cash and cash equivalents, net | FY-2028 | 3,764,288.60bn Amount | 1,207,680.15bn Amount | 1,210,458.12bn Amount | 5,509,025.01bn Amount | 8,934,530.11bn Amount | 205.3% | 5 |
| Cash and cash equivalents, net | FY-2027 | 4,217,771.43bn Amount | 1,052,546.41bn Amount | 1,082,399.54bn Amount | 6,656,215.56bn Amount | 9,702,038.38bn Amount | 205.1% | 5 |
| Cash and cash equivalents, net | FY-2026 | 4,400,216.03bn Amount | 1,682,057.07bn Amount | 2,228,877.61bn Amount | 5,980,325.87bn Amount | 8,300,832.13bn Amount | 150.4% | 4 |
| Other expenses | 4QFY-2026 | 684,258.70bn Amount | 435,163.14bn Amount | 441,698.58bn Amount | 808,806.47bn Amount | 1,169,378.93bn Amount | 107.3% | 3 |
| Net income/(loss), Applicable to common stockholders | 4QFY-2026 | 614,625.27bn Amount | 220,386.29bn Amount | 510,614.17bn Amount | 811,744.75bn Amount | 822,647.47bn Amount | 98.0% | 3 |
| Profit/(loss) for the period year | 4QFY-2026 | 614,625.27bn Amount | 220,386.29bn Amount | 510,614.17bn Amount | 811,744.75bn Amount | 822,647.47bn Amount | 98.0% | 3 |
Quarterly path
With one contributor, treat the sequence as one house's trajectory rather than a consensus inflection.
Base currency: INR · VA scales normalized from Abs, M; item currencies and units retained · Next four supplied quarters; final column is maximum broker coverage in the row.
| Quarter | Cash and cash equivalents, net | Cost of revenue | Depreciation and amortisation expense | Employee benefits expense | Finance costs | Total revenue | EPS Diluted, Applicable to common stockholders(INR) | Broker coverage |
|---|---|---|---|---|---|---|---|---|
| 2QFY-2027 | — | 1,630,510.21bn Amount | 40,803.43bn Amount | 379,001.87bn Amount | -207,841.63bn Amount | 3,295,668.42bn Amount | 3.79 Amount | 1 |
| 3QFY-2027 | — | 1,843,185.46bn Amount | 42,400.07bn Amount | 391,181.51bn Amount | -208,872.64bn Amount | 3,725,538.22bn Amount | 4.78 Amount | 1 |
| 4QFY-2027 | — | 2,197,644.20bn Amount | 44,392.47bn Amount | 405,171.82bn Amount | -214,507.59bn Amount | 4,441,987.88bn Amount | 6.41 Amount | 1 |
395 stale period values omitted; 23 line items fully removed.
Source: S&P Capital IQ transcripts via Xpressfeed · latest indexed call 2026-04-22 · generated 2026-07-21.
Latest call digest
Sunteck Realty Limited, Q4 2026 Earnings Call, Apr 22, 2026 · 2026-04-22T10:30:00
Q4 & FY26 earnings call — April 22, 2026. Prepared remarks were confident: FY26 revenue grew 32%, EBITDA 64% and PAT 34% year-on-year; full-year presales reached INR 3,157 crores, up 25%, with a net cash surplus of INR 552 crores and net debt-to-equity of 0.06x. Business development stepped up sharply — roughly INR 800 crores invested in FY26 versus INR 180 crores in FY25 — adding three projects (~INR 50 billion combined GDV) and lifting total GDV to about INR 441 billion.
The Q&A told a more two-sided story. Two pressure points dominated. First, the Dubai downtown project: management now calls it "launch-ready" but has deferred launch until the Middle East conflict settles, leaning on the low land cost and zero project debt to argue profitability is safe regardless. Second, cash conversion: collections grew only 14% against 25% presales growth and remain below half of sales, which management again pushed out, promising "very, very strong cash flow" in FY27 and FY28. Kamal Khetan acknowledged for the first time that footfalls "must have dropped by 5%, 10%" on the war, while insisting conversions held and reaffirming FY27 growth of a "similar" ~25% even without Dubai. Forward guidance actually stated: an FY27 launch pipeline of roughly INR 6,000-7,000 crores GDV and blended EBITDA margins of 35-40% (30-35% on newly-signed projects).
Participant coverage from the latest call.
| Group | Participants | Count |
|---|---|---|
| Management | Operator; Kamal Khetan — Chairman & MD, Sunteck Realty Limited; Prashant Chaubey — Chief Financial Officer, Sunteck Realty Limited | 3 |
| Analysts | Kunal Lakhan — Research Analyst, CLSA Limited, Research Division; Pritesh Sheth — Analyst, Axis Capital Limited, Research Division; Puneet Gulati — Analyst of India Energy Transition and Property & Infra, HSBC Global Investment Research; Rishith Shah — Research Analyst, Axis Capital Limited, Research Division; Abhinav Sinha — Equity Analyst, Jefferies LLC, Research Division; Unknown Analyst; Akash Gupta — Analyst, Nomura Securities Co. Ltd., Research Division | 7 |
Curated latest-call exchanges; one row per analyst topic.
| Analyst | Firm | Topic | What changed in Q&A |
|---|---|---|---|
| Kunal Lakhan | CLSA | Dubai launch timeline | Pressed on when Dubai launches given the Middle East conflict; management held that the project is launch-ready and will go "ASAP" once the event settles, stressing zero debt at both company and Dubai SPV level. |
| Kunal Lakhan | CLSA | Collections vs presales gap | Flagged FY26 collections up only 14% versus 25% presales growth and below 50% of sales; management conceded the point and deferred the step-up to FY27 and FY28. |
| Pritesh Sheth | Axis Capital | FY27 launch pipeline and margins | Sought FY27 launch GDV and blended margins; management guided ~INR 7,000 crores of GDV and 35-40% blended EBITDA margin, 30-35% on recently signed projects. |
| Puneet Gulati | HSBC | War impact on demand and inputs | Probed Mumbai pricing, footfalls and supply chain; management admitted footfalls dipped 5-10% and some imported finished-goods pressure, but framed both as one-month, temporary effects. |
| Abhinav Sinha | Jefferies | Growth durability ex-Dubai | Asked whether the similar-growth guidance holds without Dubai; management said it was "100% confident" of comparable growth irrespective of the Dubai launch. |
| Akash Gupta | Nomura | Demand drivers and discounting | Questioned whether strong demand relies on discounts or aggressive payment plans; management said it is end-user demand with "no discount" and "business as usual." |
Theme tracker
Themes are curator-classified across supplied calls.
| Theme | Status | Quarters mentioned | Read-through |
|---|---|---|---|
| Uber and premium luxury driving the presales mix and margin expansion | persisted | Q2 FY25, Q3 FY25, Q4 FY25, Q1 FY26, Q2 FY26, Q3 FY26, Q4 FY26 | The consistent core narrative: high-embedded-margin uber and premium luxury (BKC, Nepean Sea Road, ODC) carry sales and lift EBITDA margins, which expanded from the low-20s toward the high-20s over FY26. |
| Dubai downtown project — repeatedly deferred launch | persisted | Q1 FY25, Q2 FY25, Q3 FY25, Q4 FY25, Q1 FY26, Q2 FY26, Q3 FY26, Q4 FY26 | First flagged in FY25 with a launch targeted before FY26, the timeline slipped to late-FY26/early-FY27 and, by Q4 FY26, to indefinite pending the Middle East conflict. A recurring catalyst that keeps moving right. |
| Collections lagging presales growth | persisted | Q2 FY25, Q3 FY25, Q4 FY25, Q1 FY26, Q2 FY26, Q3 FY26, Q4 FY26 | Analysts have pressed on the sales-to-cash gap almost every quarter; management attributes it to construction-linked billing on newly launched projects and repeatedly defers the pickup to future years. |
| Nepean Sea Road (Emaance) marquee luxury on pre-RERA tenancy sales | persisted | Q3 FY25, Q4 FY25, Q1 FY26, Q2 FY26, Q3 FY26, Q4 FY26 | Booked as presales via tenancy/PAAA agreements ahead of RERA; the formal RERA approval and construction start were still pending as of Q4 FY26, guided to Q4 FY26 or Q1 FY27. |
| Aggressive business development and GDV compounding | persisted | Q2 FY25, Q3 FY25, Q4 FY25, Q1 FY26, Q2 FY26, Q3 FY26, Q4 FY26 | A standing message of doubling GDV roughly every three years on a high-IRR, high-equity-multiple philosophy; FY26 BD spend rose sharply and total GDV reached about INR 441 billion. |
| Aspirational / affordable segment recovery | emerged | Q3 FY26, Q4 FY26 | Newly introduced language: after years of saying only uber and premium luxury were working, management began citing early recovery in the aspirational segment on income-tax benefits and lower home-loan rates. |
| Bandra Bandstand and Borivali (ESKAY) in the forward launch pipeline | dropped | Q2 FY25, Q4 FY25, Q1 FY26 | Both featured in earlier launch pipelines (Bandra Bandstand cited as a >INR 1,000 crore FY26 launch in Q1 FY26); neither appears in the Q3 FY26 or Q4 FY26 forward launch lists, suggesting quiet deferral. |
Guidance ledger
Quotes, calls, and speakers are source-verified; outcomes are curator-classified.
| Verbatim guidance | Call | Speaker | Curator outcome | Outcome note |
|---|---|---|---|---|
| “We expect Q4 FY '25 to be the best-ever quarter on presales till date for Sunteck given our upcoming launches and strong presales momentum.” | Sunteck Realty Limited, Q3 2025 Earnings Call, Jan 21, 2025 · 2025-01-21T11:00:00 | Kamal Khetan | kept | Q4 FY25 presales came in at a record INR 870 crores, as reported on the following call. |
| “we are confident of achieving similar growth in FY '26 with higher margins.” | Sunteck Realty Limited, Q4 2025 Earnings Call, May 05, 2025 · 2025-05-05T10:30:00 | Kamal Khetan | kept | FY26 presales grew 25% and the full-year EBITDA margin rose to 27% from 22% in FY25. |
| “And we will be looking to launch towards the later part of the FY '26 or early FY '27.” | Sunteck Realty Limited, Q4 2025 Earnings Call, May 05, 2025 · 2025-05-05T10:30:00 | Kamal Khetan | pending | The FY26 window passed without a Dubai launch; by Q4 FY26 the project was described as launch-ready but deferred pending the Middle East conflict. |
| “we are confident of taking our GDV to more than INR 500 billion from the current GDV of INR 400 billion.” | Sunteck Realty Limited, Q1 2026 Earnings Call, Jul 18, 2025 · 2025-07-18T10:30:00 | Kamal Khetan | missed | Management clarified this was a March-FY26 target; total GDV stood at about INR 441 billion at the FY26 close, short of INR 500 billion. |
| “we have set a target to launch new projects worth INR 110 billion GDV value in the coming 3 quarters of the financial year FY '26.” | Sunteck Realty Limited, Q1 2026 Earnings Call, Jul 18, 2025 · 2025-07-18T10:30:00 | Kamal Khetan | unknown | Several launches proceeded through the year, but the call history does not disclose an aggregate launched-GDV figure to confirm the INR 110 billion target. |
| “So it can be close to INR 6,000 to INR 7,000 crores GDV.” | Sunteck Realty Limited, Q4 2026 Earnings Call, Apr 22, 2026 · 2026-04-22T10:30:00 | Kamal Khetan | pending | Forward FY27 launch pipeline guidance; outcome not yet observable in the supplied call history. |
| “So blended EBITDA margin, we are looking at minimum 35% to 40%.” | Sunteck Realty Limited, Q4 2026 Earnings Call, Apr 22, 2026 · 2026-04-22T10:30:00 | Kamal Khetan | pending | Forward margin guidance for the FY26 presales cohort and recently signed projects; not yet realized in the reported P&L. |
Q&A pressure map
Question counts and firms are curator tallies; analyst coverage shown above.
| Topic | Questions | Firms | Pressure / response |
|---|---|---|---|
| Dubai project — launch timing and economics | 14 | CLSA, HSBC, Jefferies, Emkay Global, Equirus | The single most-pressed topic across the history. Analysts repeatedly sought a firm launch date and the invested amount; management consistently deferred timing while emphasising low land cost, zero debt and a claimed ~20x return on the AED 70 million plus AED 60 million invested. |
| Collections lagging presales | 9 | Axis Capital, Motilal Oswal, JM Financial, Investec, CLSA | Recurring pressure on why cash collection trails booking growth. Management declined to give a collections number ("giving guidance of collection would be very hard") and pushed the step-up to FY27/FY28 as construction on new launches advances — a consistent deferral rather than a direct near-term answer. |
| Launch pipeline and GDV targets | 10 | Axis Capital, Jefferies, Emkay Global, Nuvama, Arihant Capital | Analysts pushed for project-level launch timing and GDV magnitudes; management supplied long lists of upcoming launches but hedged the phasing on approval uncertainty outside its control. |
| Nepean Sea Road status and RERA | 6 | Kotak Securities, Arihant Capital, JM Financial, Antique Stockbroking | Persistent questions on the RERA approval and construction start for the marquee Emaance project. When Kotak suggested the RERA had "dragged," management pushed back that the Q4 FY26/Q1 FY27 timeline had never changed. |
| Margins and pricing | 5 | Axis Capital, HSBC, Jefferies | Questions on blended EBITDA margins and Mumbai pricing direction; management guided 35-40% blended margins and signalled it no longer expects much price rise, preferring volume/velocity. |
Language shifts
Only language evidence verified against the referenced component is shown.
| Observation | Verbatim evidence | Call ID | Component |
|---|---|---|---|
| New optimism on the aspirational/affordable segment, previously described as the weak part of the market — now framed as recovering on tax and rate tailwinds. | “the aspirational luxury segment is also showing some signs of initial recovery given the decrease in home loan rates and income tax benefits.” | 1995646825 | 1 |
| First explicit acknowledgment of demand softness, with a quantified footfall drop attributed to the war — a shift from unqualified bullishness in prior calls. | “Footfalls, I can say definitely must have dropped by 5%, 10% for sure.” | 1995646825 | 32 |
| New caution vocabulary on the broader market one quarter earlier, calling conditions "fragile" while still defending Sunteck's own performance. | “So market, we all see is slightly fragile, definitely.” | 1978764685 | 38 |
| Tempered pricing outlook — management moved from expecting appreciation to guiding for stable prices and volume-led growth. | “I feel that we should not expect too much of price rise from here.” | 1995646825 | 30 |
Across twelve calls the presales-and-margin story has been remarkably consistent and, on the near-term guidance, largely delivered. What the history sharpens is the gap between that operating story and its catalysts: Dubai has been unlaunched since first flagged in FY25, Nepean Sea Road remains pre-RERA, collections keep trailing sales, and the INR 500 billion GDV target slipped. With management now conceding softer footfalls and a "fragile" market, the debate turns on whether the high-margin launch pipeline converts to cash before demand cools.
Sunteck Realty is a founder-controlled, Mumbai-only luxury developer whose operating story keeps improving — record FY26 pre-sales of ₹3,157 Cr and a record ₹202 Cr profit, on a near-debt-free balance sheet — while the stock has done the opposite: roughly ₹315 today, half its July-2024 peak and about where it traded fifteen years ago. This chapter orients a cold reader to what the company is, how it earns, and frames the tension the rest of the report examines.
What Sunteck is
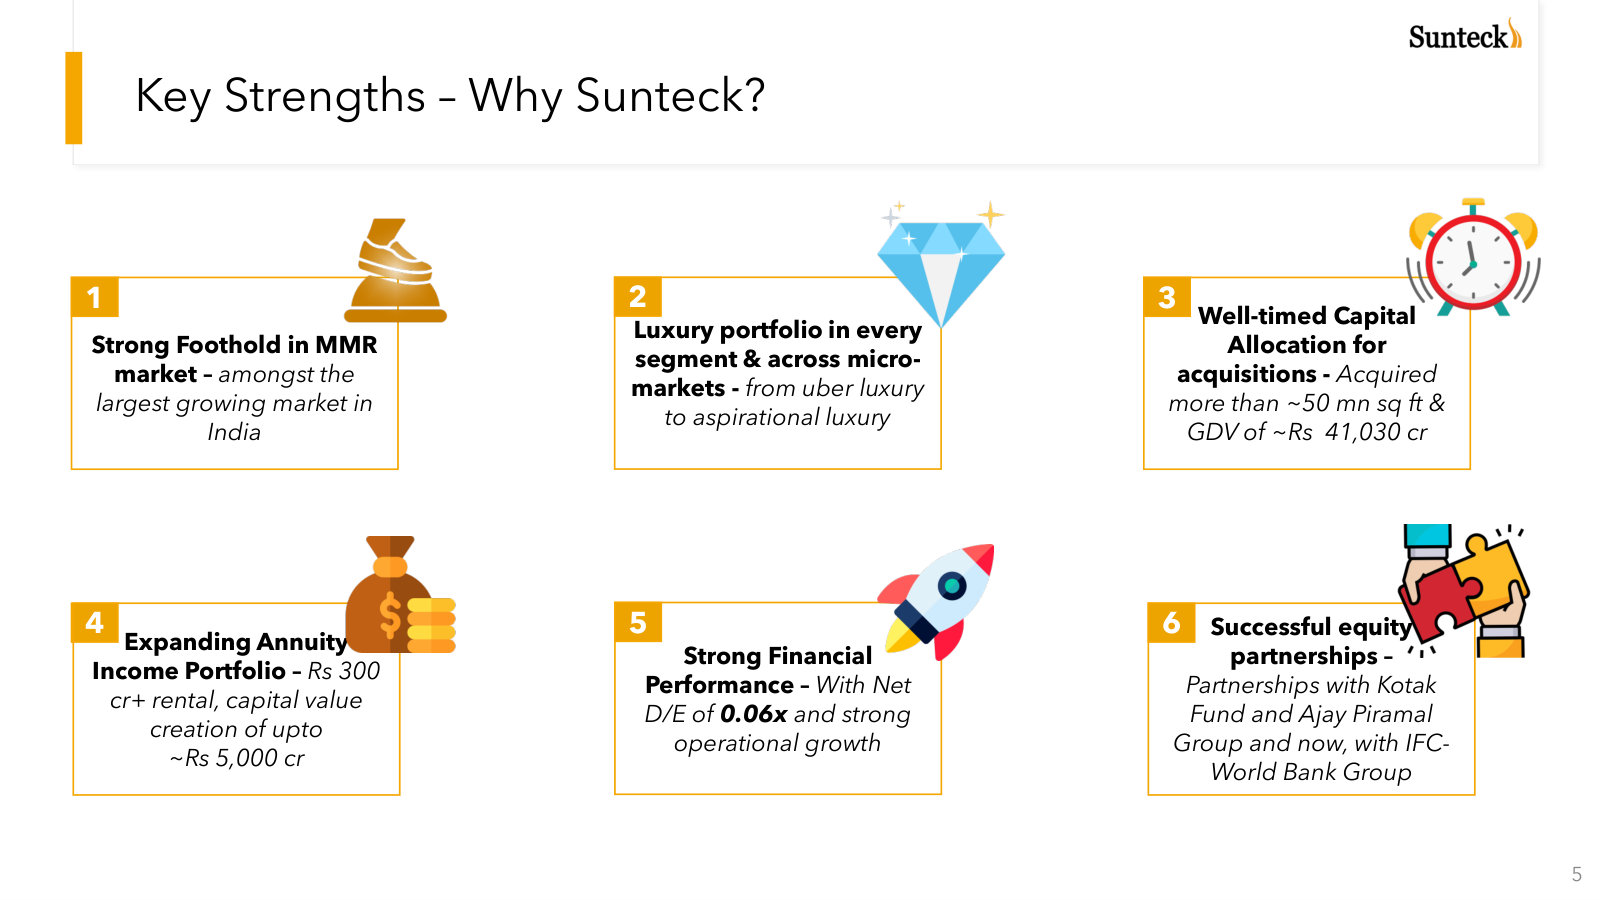
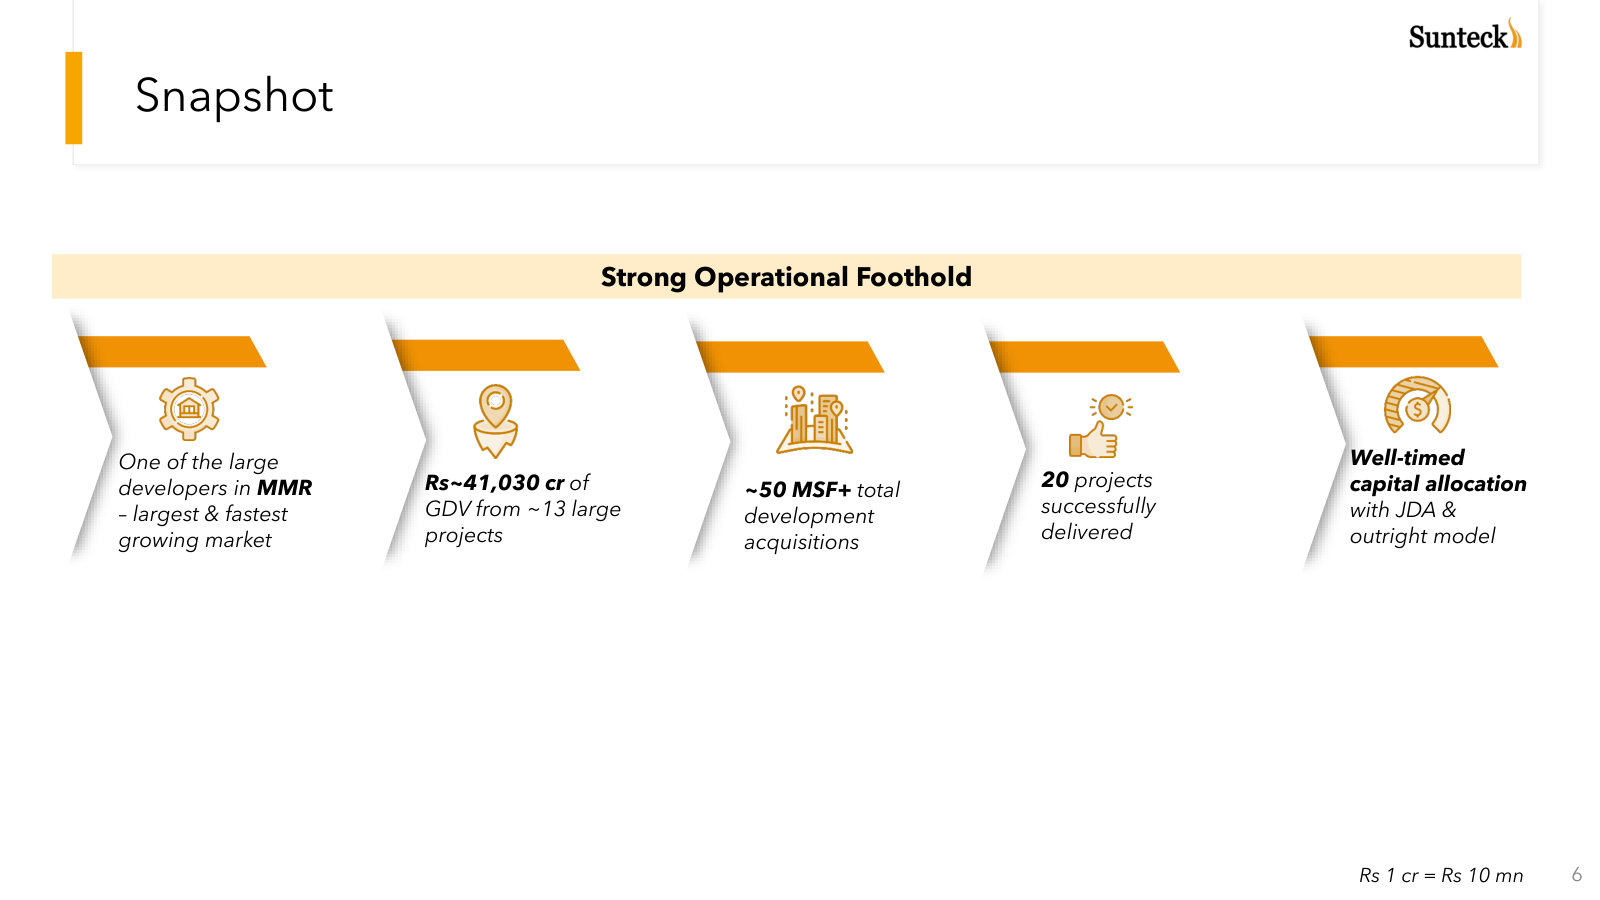
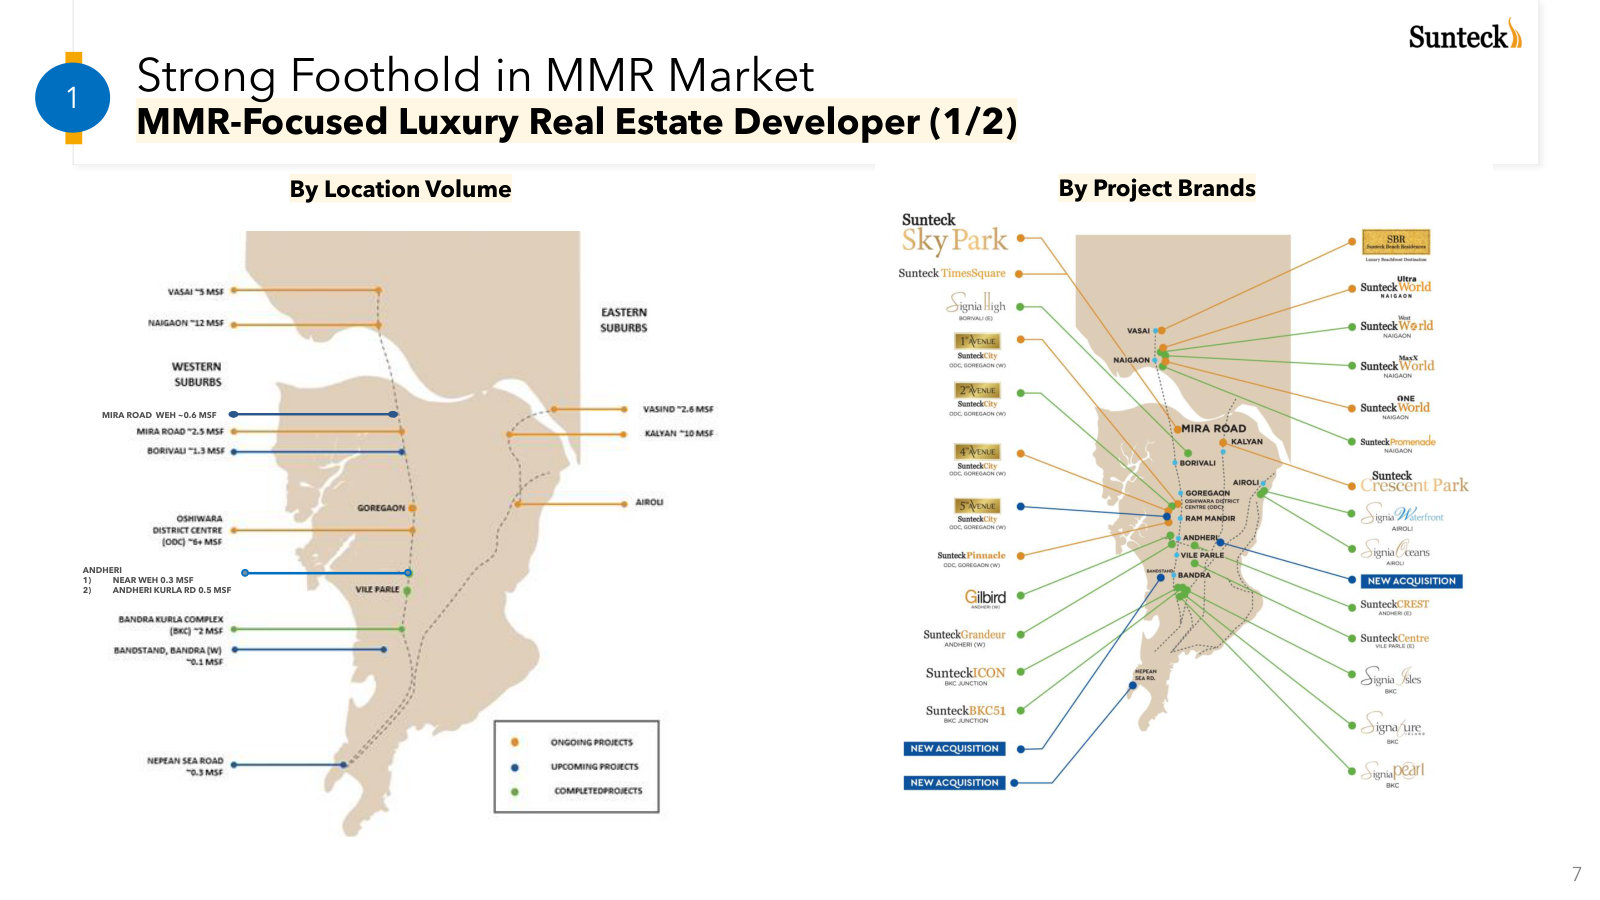
Sunteck Realty Limited (NSE: SUNTECK) develops residential and mixed-use real estate concentrated almost entirely in the Mumbai Metropolitan Region (MMR). It is not a national builder; it is a city-centric operator that has assembled a portfolio of more than 50 million sq ft with a launched-and-balance gross development value (GDV) of roughly ₹41,030 Cr, spanning six brand tiers from "uber luxury" (Signature, Signia) down to "aspirational luxury" (Sunteck World). 50 mn sq ft, GDV ~₹41,030 cr, uber-to-aspirational luxury portfolio" rel="nofollow" class="markdown">[1] Including pre-sales already booked, management puts total GDV at approximately ₹44,100 Cr as of FY26. [2]
The business is promoter-controlled. Founder Kamal Khetan built the company and runs it as combined Chairman & Managing Director; the promoter family's holding sits in a set of trusts — Matrabhav (31.9%), Paripurna (13.2%) and Astha (10.5%) among them — that together anchor majority control. 5%: Matrabhav Trust 31.90%, Paripurna Trust 13.23%, Astha Trust 10.53%" rel="nofollow" class="markdown">[3] This is the founder-with-skin-in-the-game profile in its purest form; the precise total promoter stake, its trajectory, and how management is paid are questions later chapters take up directly.
How it makes money
Sunteck's engine is residential pre-sales — flats sold, and cash collected, well before revenue is recognised. Reported revenue and profit are the accounting echo of projects completing; the leading indicator is the pre-sales line, which has grown for five straight years:
Pre-sales and gross collections, ₹ Cr. Source: FY26 investor presentation, [4].
The model is deliberately capital-light on land: much of the pipeline comes through joint-development agreements (JDAs) and redevelopment rather than outright purchases, which management frames as a "high IRR and high equity multiple" philosophy. [5] In FY26 it added three MMR projects (Andheri redevelopment, a Mira Road JDA, and an outright Andheri land parcel) carrying a combined GDV near ₹50 bn, and spent ₹813 Cr on that business development — versus just ₹184 Cr the prior year. [6]
The financial arc
On the reported numbers, FY26 was the best year in the company's history. Revenue grew 32% year-on-year and profit after tax reached a record, the culmination of revenue roughly doubling since FY24 as premium inventory was recognised. [7]
FY26 revenue
— +32% YoY Yoy
Consolidated revenue, net profit and basic EPS, FY24–FY26. Source: exchange XBRL filings (data/financials/income.json).
A balance sheet built not to break
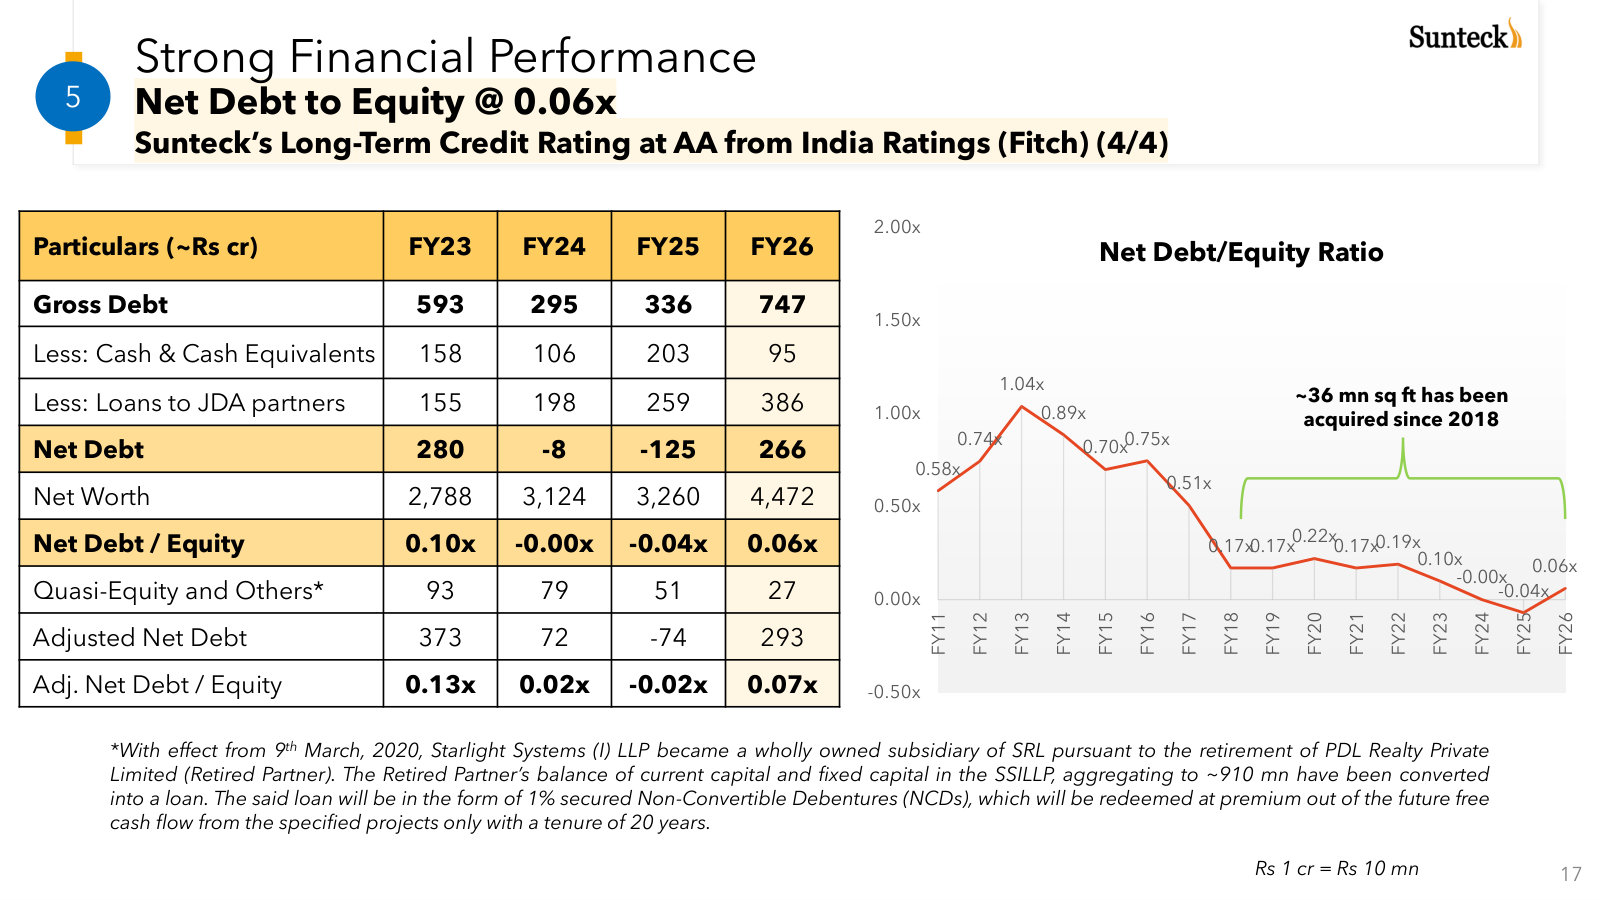
For a value investor whose first fear is bankruptcy, Sunteck's most important number may be its leverage. Net debt was ₹266 Cr against ₹4,472 Cr of net worth at end-FY26 — a net debt-to-equity of 0.06x — even after the year's aggressive land spend, and the company ran net-cash in FY24 and FY25. [8] That is not a one-year posture but the end of a long deleveraging: net debt-to-equity ran above 1.0x in FY13 and has trended down for a decade.
Consolidated net debt-to-equity. Source: FY26 investor presentation, [9]. The company carries an AA long-term rating from India Ratings (Fitch). [10]
What the stock has done
Now the other side. Despite the compounding pre-sales and the record profit, the equity has been a serial disappointment. The share closed near ₹315 on 21 July 2026 — down roughly 50% from a July-2024 peak of about ₹630, and, remarkably, below where it traded in 2010.
Year-end closing price, NSE. Source: daily price series (data/prices/daily.json); 2026 value is the 21-Jul close.
The recent slide has a cause an operator can point to: the company has missed consensus EPS in three of the last four quarters (−19.6% in Q4 FY26, −4.3% in Q3, −10.9% in Q2), as recognition timing slipped against Street models. [11] A luxury developer's profits arrive lumpily; the market has been repricing that lumpiness as disappointment.
What you pay, and what it implies
At ₹315 on roughly 14.5 crore shares, the market values Sunteck at about ₹4,566 Cr — essentially 1.0x its FY26 book value of ₹4,472 Cr, and near 23x trailing earnings. Set against the pipeline, the market capitalisation is only about 10% of the ₹44,100 Cr total GDV — the classic deep-asset-below-appraised-value shape, with the obvious caveat that GDV is gross sales value over many years, not net present value to shareholders.
Market cap
Price / book
P/E (FY26)
Mkt cap ÷ GDV
Book value from FY26 balance sheet; GDV from [12]. Multiples computed on 14.5 crore shares.
The eleven-to-twelve sell-side analysts covering the name model EPS of ₹18.98 for the current year and ₹22.49 the next — 37% then 18% growth — and carry a mean price target of ₹517 (range ₹425–₹610), implying they see the stock as roughly 64% too cheap. [13] Whether that gap is opportunity or a warning is precisely what this report has to adjudicate.
The through-line
There is a genuine contradiction on the page. The operating business is compounding, the balance sheet is close to unbreakable, and the founder owns most of it — yet a subtler number complicates the "fortress cash machine" reading. Management reports a net cash-flow surplus of ₹552 Cr for FY26, but that figure is struck before the ₹813 Cr of land and business-development spend; [14] once that investment is counted, the company consumed cash in FY26 and swung from net-cash to net-debt. Whether reinvesting the operating surplus (and more) into new MMR land is the right use of shareholders' money — or the reason record accounting profit again failed to reward the stock — is the crux.
That contradiction frames the report:
Is Sunteck a genuine fallen star — a founder-controlled, low-leverage developer whose compounding pipeline is worth a large multiple of today's ₹4,566 Cr market value — or a company whose "record" profits keep failing to convert into shareholder returns, leaving the low price fairly earned?
Every later chapter — the three-year financials and forward estimates, insider ownership and pay, the durability of the MMR tailwind, the quality of reported cash, and what the price ultimately implies — is a test of one side of that question or the other.
Financials and Estimates
Sunteck's income statement has inflected hard: revenue roughly tripled from a ₹362 Cr trough in FY2023 to ₹1,124 Cr in FY2026, and profit went from breakeven to ₹202 Cr. But the cash statement tells a second story — FY2026 operating cash flow was negative ₹433 Cr, the first outflow since FY2022, as the company poured collections and fresh capital into land and inventory. Balance-sheet risk stays low; returns on equity do not yet match the profit headline.
Figures are consolidated, in Indian rupees (₹ crore), unless stated. This chapter surfaces the three-year record and the forward estimates as a standalone view; the balance-sheet and pipeline framing is set in The Fallen Star.
The three-year record
FY2026 Revenue (₹ Cr)
FY2026 PAT (₹ Cr)
FY2026 EPS (₹)
EBITDA Margin
Return on Equity
Net Debt (₹ Cr)
Sources: FY2026 P&L and leverage — Q4 & FY26 investor presentation [1], [2]); ROE derived from reported financials.
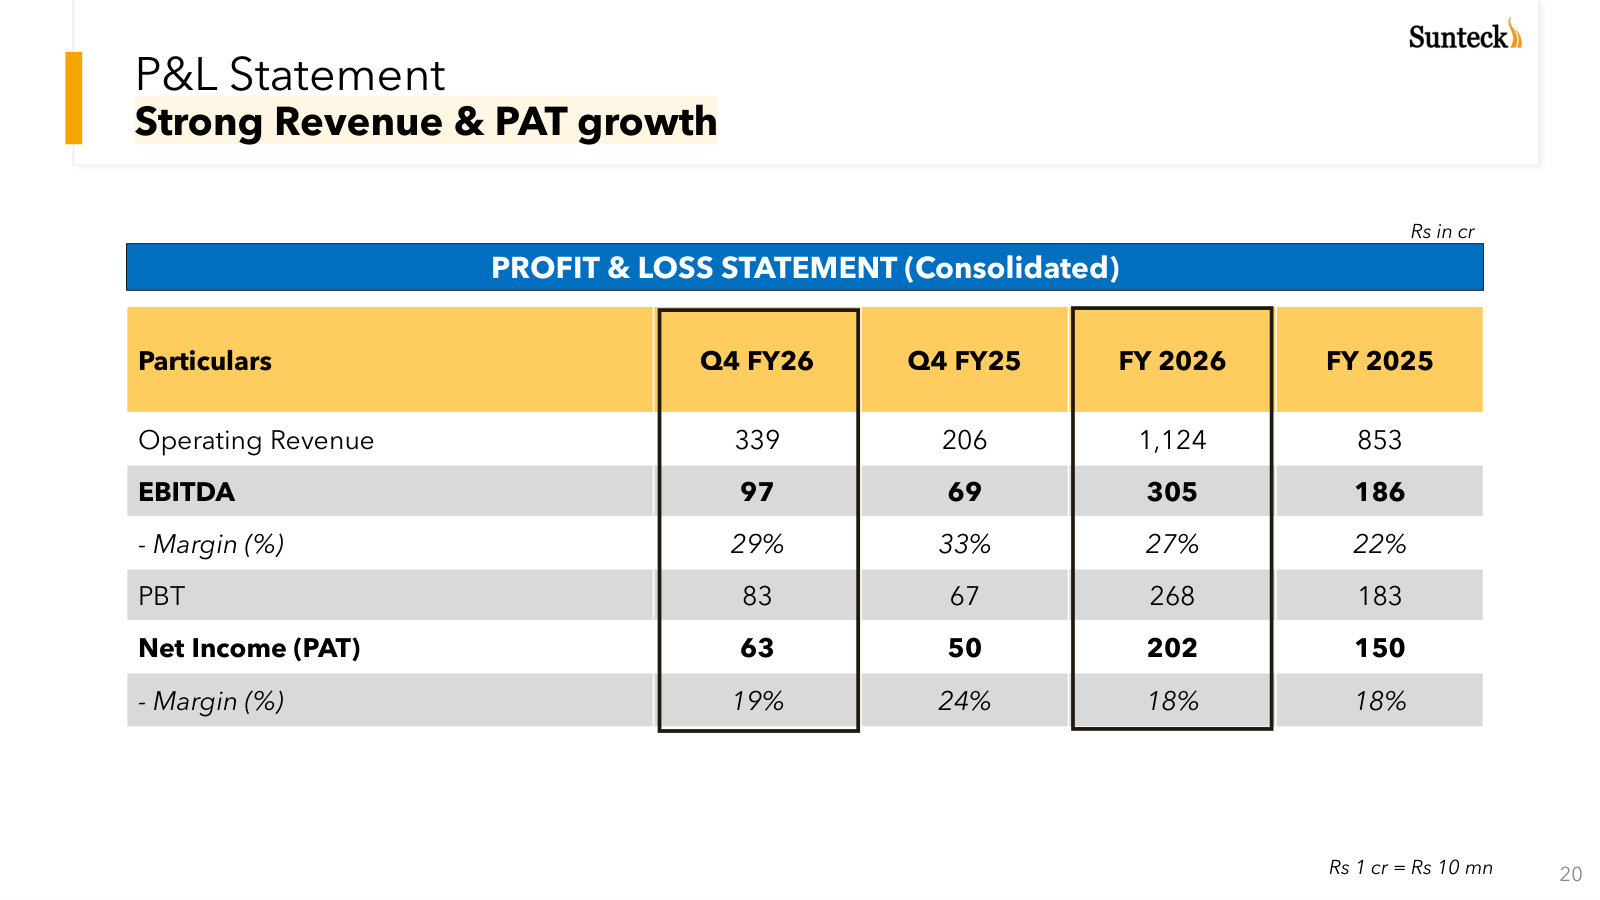
Revenue nearly doubled in two years and profit ran far ahead of it: FY2026 operating revenue was ₹1,124 Cr against ₹853 Cr in FY2025 and ₹565 Cr in FY2024, while PAT of ₹202 Cr followed ₹150 Cr and ₹71 Cr [3], [4]). The starting point matters: FY2023 was effectively breakeven, with consolidated revenue of ₹362 Cr and profit after tax of ₹1.4 Cr (EPS ₹0.10) [5]. Measured off that trough the recovery looks dramatic; measured off FY2019, when the group earned ₹241 Cr, FY2026 is closer to a return to prior form than a new peak.
Sources: FY2024–FY2026 from Q4 & FY26 investor presentation [6]); FY2022–FY2023 from FY2023 Annual Report P&L [7]).
Two features of this business shape how the numbers read. First, revenue is lumpy by design: Sunteck recognises income on completed or handed-over inventory, so a single tower's completion can swing a year, and the ₹362 Cr FY2023 dip was recognition timing, not a collapse in demand. Second, margins are widening as the mix shifts — EBITDA margin rose from 21% in FY2024 to 27% in FY2026, and net margin from 12.6% to 18.0% [8].
Source: derived from reported financials, FY2022–FY2026 consolidated results [9]).
The gap between the two lines matters: net margin has climbed to a healthy 18%, but return on equity — even in a record year — is only 5.6%, up from 2.3% in FY2024 [10]. A developer that earns roughly 5–6% on its book, trading near book value, is not cheap on current earning power; the case has to rest on the appraised value of the land and pipeline that book carries, not on the profit-and-loss statement as it stands. That is a question for the asset-value work, not this chapter.
Where the profit went: cash conversion
Through FY2025, reported earnings converted to cash well — cumulative operating cash flow across FY2023–FY2025 was ₹561 Cr against cumulative PAT of ₹222 Cr. FY2026 broke that pattern. Operating cash flow was negative ₹433 Cr, and free cash flow negative ₹589 Cr, the weakest since the pandemic year.
Source: consolidated statements of cash flow as reported in filed annual results, FY2022–FY2026; FY2023 statement [11].
The mechanism is inventory. The consolidated balance sheet's inventory line rose from ₹6,206 Cr at FY2025 to ₹7,896 Cr at FY2026 — a ₹1,690 Cr build of land and work-in-progress that a developer books through working capital. Collections were strong (gross cash collections of ₹1,433 Cr, up from ₹1,255 Cr), but the year's deployment ran well ahead of them. Management frames the same facts differently: it reports a "Net Cash Flow Surplus" of ₹552 Cr, then discloses ₹813 Cr "spent on BD/LO/JDA" — business development, land options and joint-development costs — on the line directly below [12]. Counting that ₹813 Cr — which was 4x FY2026 profit and up from ₹184 Cr the prior year — the surplus becomes a deficit, which is what the statutory cash flow shows.
This is discretionary growth spending, not distress: the outflow bought roughly ₹5,000 Cr of new gross pipeline value, and it was financed, not forced. The result, though, is a builder whose record profits did not turn into free cash in FY2026 because it chose to consume cash to expand. Whether that reinvestment earns its keep is what the estimates below test.
Balance sheet: low risk, on any definition
For a reader who wants the chance of bankruptcy near zero, the balance sheet is the reassuring part of the file. Net worth grew to ₹4,472 Cr, and even after the FY2026 land spend, management reports net debt of just ₹266 Cr — a net-debt-to-equity ratio of 0.06x, with an AA long-term rating from India Ratings (Fitch) [13].
Source: Q4 & FY26 investor presentation, net-debt bridge (₹ crore) [14].
One line in that bridge deserves a reader's attention. Management's ₹266 Cr net-debt figure nets out ₹386 Cr of "Loans to JDA partners" as if it were cash. Strip that credit and count only actual cash against gross debt of ₹747 Cr, and net debt is closer to ₹652 Cr — still just 0.15x net worth. The distinction matters for how "fortress" the balance sheet is (the JDA loans are advances to partners on specific projects, not liquid cash), but it does not change the conclusion: gearing is low on either definition, and the maturity of gross debt is small against ₹4,472 Cr of equity. The company also carries ₹7,896 Cr of inventory — largely land and projects under development — so the assets backing that equity are real, if illiquid.
A second nuance sits behind the net-worth figure. Strip the ₹861 Cr of one-year-old NCI (only ₹66 Cr of it cash) from Sunteck's ₹4,472 Cr net worth and a Sunteck share owns just ₹3,611 Cr, turning the '1.0x book / 10% of GDV' cheapness into ~1.26x owners' book with the market paying ₹955 Cr — 2.3% of GDV — for the entire development surplus. That non-controlling interest grew during FY2026 alongside a preferential capital raise; the full ownership and capital-structure treatment is carried in The Downside Floor.
Forward estimates: bullish targets, softening at the edges
Eleven-to-twelve analysts cover the stock, and the consensus is uniformly positive on both the numbers and the price. Revenue is expected to grow to roughly ₹1,495 Cr in FY2027 and ₹1,762 Cr in FY2028; EPS is seen rising from ₹13.94 actual to about ₹18.98 and ₹22.49 over the same two years — implying forward P/E of 16.6x on FY2027 and 14.0x on FY2028 against 22.6x trailing.
Source: FY2024–FY2026 as reported (investor presentation [15])); FY2027–FY2028 consensus of 11 analysts, as compiled.
Every one of the twelve covering analysts rates the stock a buy or strong buy, with a mean price target of ₹517 and a median of ₹516 against a ₹315 share price — roughly 64% above the market, with a range of ₹425 to ₹610, as compiled. On its face this is the setup a fallen-star investor looks for: a stock the tape has halved, and a covering analyst base that still sees substantial upside.
The honest caveat is in the revision trend. Over the last 90 days the consensus FY2027 EPS estimate has been cut from about ₹21.5 to ₹19.0, and in the most recent week six analysts trimmed their forward numbers against one raise — the estimates are drifting down even as the targets stay high. Consensus here is a starting point, not a verdict: the price targets assume the ₹813 Cr the company just deployed converts into pre-sales and, eventually, recognised revenue on management's timeline. That conversion, not the current profit, is what the forward numbers are really underwriting.
What would change the read
The financial file supports a measured, two-sided read. The income statement has genuinely inflected and margins are widening; the balance sheet carries near-zero solvency risk on any definition, which addresses the bankruptcy concern directly. Against that, return on equity is still only 5.6%, FY2026 free cash flow was deeply negative on discretionary land spend, and forward estimates — though attached to bullish targets — are being revised down. A single year of positive operating cash flow with the pipeline converting to recognised revenue would confirm the reinvestment is working; a second year of negative operating cash flow without a step-up in pre-sales conversion would suggest the ₹813 Cr was growth for its own sake.
Ownership and Pay
Kamal Khetan and his family control 63.3% of Sunteck, held mostly through three family trusts and unpledged, and in FY2026 they committed a fresh ₹333 crore of their own money to buy warrants now struck above the market price [1]. The founder's cash pay is small — ₹4.05 crore, no commission, no options, and a pay-to-median ratio that has fallen every year for five years [2]. The alignment is real; two facts qualify it, and both are on the page below.
What the promoter owns
The promoter and promoter group held 63.28% of Sunteck at 31 March 2025, worth roughly ₹2,890 crore against the ₹4,566 crore market capitalisation the Financials and Estimates tab established [3]. That is the first thing a founder-alignment reader looks for: the person running the company owns most of it, and the value of that stake dwarfs every other form of compensation on offer.
Source: FY2025 Annual Report, Report on Corporate Governance — Shareholding Pattern (category-wise) [4].
The float is high-quality, not retail froth: foreign portfolio investors hold about 19.3%, and domestic institutions — insurers, mutual funds and alternative funds — roughly 8.2% [5]. Only about 9% sits with the retail public. So the price the Fallen Star tab described — halved from its 2024 peak and flat for fifteen years — is a mark set by institutions, not a thinly-traded promoter shell.
Where the promoter holding sits matters as much as its size. Nearly all of it is in three family trusts rather than in Khetan's personal name.
Source: FY2025 Annual Report, Notes to the Standalone Financial Statements — Shareholding of Promoters [6].
Three trusts — Matrabhav (31.90%), Paripurna (13.23%) and Astha (10.53%) — hold 55.7% of the company between them, roughly 88% of the entire promoter block [7]. Trust ownership is a long-horizon structure — it points to succession and estate continuity rather than a founder positioned to exit — but it also concentrates control tightly and makes the family's economic interest harder for an outsider to track share-by-share. The filings disclose no pledge or encumbrance on the promoter equity; the pledges the annual report does record are project-level, such as a 28% pledge of a subsidiary's shares against a specific term loan, not the family's Sunteck stake [8]. For a reader who wants bankruptcy risk near zero, an unpledged promoter stake removes one of the classic Indian small-cap failure modes — the margin call that forces a controlling family to dump shares.
Where the stake shrank
Promoter holding was not static. It sat at 67.15% in FY2021 and held near 67% for three years, then stepped down to 63.24% in FY2024 and has been flat since [9] [10].
Source: Reports on Corporate Governance, FY2021–FY2025 Annual Reports [11] [12].
The 4-point drop was not a broad distribution. Two promoter-group companies — Satguru Infocorp Services and Starlight Systems — went from 2.05% each to zero during FY2024, together releasing about 6.0 million shares, roughly 4% of the company [13]. That sale, into a share price that was near its highs at the time, is the strongest fact against an unqualified skin-in-the-game read: the family took some money off the table before the stock fell. Set against a still-63% stake and the reinvestment that follows, it reads as trimming rather than exit — but it is a debit, and an honest ledger records it.
A gentler, older signal runs the other way. Through FY2021 and FY2022 the promoters voluntarily waived half of their own dividend — taking ₹0.75 per share while non-promoter holders received ₹1.50 — foregoing cash so more of the payout reached minority holders [14]. That waiver ended from the FY2023 dividend onward, when promoters began taking the full ₹1.50 alongside everyone else — a small erosion of a shareholder-friendly habit, worth noting precisely because it moved the same direction as the FY2024 trim.
How the founder is paid
Kamal Khetan's cash compensation is modest and unusually clean. In FY2025 he was paid ₹4.05 crore — entirely salary, with no bonus, no commission on profits, and no stock options [15]. For a promoter-chairman of a company earning ₹150 crore of net profit, a commission-free salary is on the restrained end: many Indian founders draw a percentage-of-profit commission that scales their pay with reported earnings. Khetan does not.
MD Pay, FY2025 (₹ cr)
MD Pay ÷ FY2025 PAT
Family Stake (₹ cr)
Source: FY2025 remuneration and shareholding, FY2025 Annual Report; PAT per reported financials [16] [17].
The scale check is what makes the pay a non-issue. Khetan's ₹4.05 crore salary is about 2.7% of FY2025 net profit, and a rounding error against the family's ~₹2,890 crore equity stake — a one-day 0.15% move in the share price changes the family's wealth by more than his entire annual salary. His incentive is the share price, not the salary. That is precisely the structure a founder-alignment investor wants: the person setting strategy gets rich the same way minority holders do, through the share price, not through a pay packet that pays out whether the stock works or not.
The trend reinforces it. The ratio of the managing director's pay to the median employee's has fallen every year for five years — from 36.9x in FY2021 to 25.2x in FY2025 — as employee pay rose faster than the founder's [18] [19].
Source: Ratio of Remuneration disclosures, FY2021–FY2025 Board's Reports [20] [21].
The FY2026 warrant issue
The most current piece of evidence is a capital raise still in motion. In September 2025 the board approved a preferential issue of 1,17,64,705 convertible warrants at ₹425 each (face value ₹1 plus a ₹424 premium), raising ₹500 crore, with two-thirds going to the promoter group [22].
Source: FY2025 Annual Report, Notice of AGM — Item 5 preferential-issue allottee table [23].
Three points make this the live alignment test. First, the promoters are putting in real money — about ₹333 crore of the ₹500 crore, all beneficially owned by Kamal and Manisha Khetan, which nudges the promoter stake up from 63.30% toward 63.54% on full conversion rather than diluting it [24] [25]. Under the warrant mechanics they pay 25% on allotment — roughly ₹83 crore — and the remaining 75% only on conversion, within an 18-month window, forfeiting the upfront money if they let the warrants lapse [26].
Second, the non-promoter half of the issue went to named individual investors — Utpal Sheth, Mukul Agrawal, BW South Asia and the NTAsian Discovery fund — rather than to anonymous institutions [27]. Marquee private investors committing capital on the same terms as the promoter is a corroborating signal, though it is a soft one — these are private allottees, not an arm's-length market clearing price.
Third, and this is the honest counterweight, the price was set at the regulatory floor, not at a premium. SEBI's formula put the minimum at ₹423.31 (the 90-day volume-weighted average) and the board priced the warrants at ₹425 — essentially the floor [28]. Promoters buying at the legal minimum is conviction, but it is conviction bought as cheaply as the rules allow.
The stock has since fallen to about ₹315 — roughly 26% below the ₹425 conversion price. The promoters are now committed to buy their own shares above the market. Whether they convert (paying the remaining ₹250 crore for stock they could buy cheaper on the exchange) or forfeit the ₹83 crore upfront is a clear forward test of promoter conviction — resolved by the 18-month exercise window, which runs to roughly late FY2027.
Source: warrant terms per FY2025 AGM notice; ₹315 price per the Financials and Estimates tab [29].
Governance: control is concentrated
The board is seven directors, four of them independent, so the composition clears the SEBI majority-independent bar for a company with an executive chairman [30]. But control is concentrated in the ways that matter to a minority holder. Kamal Khetan holds the combined role of Chairman and Managing Director, so board leadership and executive management sit with the same person [31]. The one other long-serving executive director, Rachana Hingarajia, also serves as Company Secretary and Compliance Officer — the person who runs the board's governance machinery is herself an executive insider [32].
This is common in founder-run Indian real estate and is not a red flag on its own; the independent-majority audit committee and the appointment of a monitoring agency for the warrant proceeds are the standard offsets. But it is a factor worth weighing: the alignment here comes from ownership, not from governance checks that would restrain a controlling family. The family's 63% stake is what protects the minority holder — its interests and theirs run together — far more than the board structure does.
The evidence points to genuine, high promoter alignment: a controlling, unpledged, mostly-trust-held stake worth roughly ₹2,890 crore, a modest commission-free salary that is trivial against it, and a fresh ₹333 crore promoter commitment now sitting above market. The main risks to that read are the FY2024 trim of about 4% by two promoter entities and the fact that the new warrants were priced at the regulatory floor and are the family's to walk away from. What would settle it, one way or the other, is the warrant conversion decision that must land by roughly late FY2027.
Pipeline to NAV
Sunteck's value case is an asset case, not an earnings one — a 5.6% return on equity does not justify the price, so the question is what the ₹41,030 Cr development pipeline is worth to a shareholder. On a disciplined bridge, Sunteck's ₹41,030 Cr pipeline is worth roughly ₹440 a share (range ₹365-₹538) against a ₹315 price, so the fallen-star discount is real but far narrower than the raw 10%-of-GDV framing suggests. Gross development value is a multi-year, gross sale figure, not value in hand: at the FY26 pre-sales run-rate it is roughly 13 years of selling; four brokers, working independently, cluster at ₹525–₹543.
What "GDV" actually is
Sunteck frames its pipeline as gross development value: ₹44,100 Cr gross of pre-sales, or a balance ₹41,030 Cr excluding sales already booked, across roughly 50 million square feet [1] [2]. That balance has nearly tripled in four years, from ₹13,650 Cr in FY22 [3].
Source: Q4 FY2026 investor presentation, GDV portfolio detail [4].
Three properties of that number decide how much of it a shareholder ever sees. First, it is gross sale value, not profit: against it sit land payments still owed, roughly a decade of construction cost, and tax. Second, most of the portfolio is built on joint-development agreements — 36 of the ~50 million square feet [5] — where Sunteck keeps only a "constructed area share" negotiated with each landowner, a split the auditor tests project by project [6]. Third, it is realised slowly. Against FY26 pre-sales of ₹3,157 Cr, the balance pipeline is about 13 years of selling at the current run-rate [7]. Even if pre-sales keep compounding in the low-20s percent, the tail runs the better part of a decade — which is why an undiscounted ₹41,030 Cr overstates present value.
The book already tells you the land was cheap relative to its selling ambition: at FY25 the group carried land and development rights of ₹3,017 Cr against a ₹39,370 Cr GDV — under 8% — all of it held "at cost or net realisable value, whichever is less" [8]. By FY26 total inventory had grown to ₹7,896 Cr, still at cost. The gap between that cost basis and the pipeline's sale value is the development surplus — the thing a valuation has to size and then discount.
Sizing the surplus
Sunteck does not publish a net asset value; the closest management gets is a 2023 "intrinsic value" slide that added seven residential "growth engines" worth ₹30,300 Cr of GDV to two pre-leased BKC commercial assets carrying ~₹1,050 Cr of capital value and ~₹49 Cr of annual rent [9]. That is a GDV tally, not a per-share value. Building the bridge is left to the analyst.
The honest way to do it is to convert GDV into the post-tax profit it can throw off, discount that back, and add it to the capital already invested. Sunteck's FY26 economics give the margin anchor: a 27% EBITDA margin, a 23.8% pre-tax margin, and an 18.0% net margin [10]. Applying a post-tax margin to Sunteck's economic share of the balance GDV gives the pipeline's cumulative profit; a present-value factor collapses it for the decade-long realisation; adding the owners' equity already on the books — ₹3,611 Cr, which funds the inventory at cost, net of debt and minorities [11] — yields net asset value to shareholders.
Source: derived from FY2026 balance GDV, margins and equity [12] [13] [14]; values in ₹ per share.
The grid runs from ₹365 to ₹538 a share, with a central case near ₹440 — comfortably above the ₹315 price, and most sensitive to the realised margin and the monetisation speed. Two commercial annuity assets in BKC add a modest slice on top: Equirus values the annuity stream, then ~₹70 Cr a year and expected to grow roughly fivefold, as a separate SOTP leg, and management's own 2023 mark put their capital value near ₹1,050 Cr [15]. Held conservatively, that is worth another ₹40–₹70 a share; it is not the crux.
What the market pays for the pipeline
The market's own arithmetic frames the gap cleanly. At ₹315, the ₹4,566 Cr market capitalisation is ₹3,611 Cr of owners' book equity plus a ₹955 Cr premium — and that premium is everything the market is paying for the entire future development surplus on a ₹41,030 Cr pipeline [16]. That is 2.3% of balance GDV, and about ₹66 a share. Set against Sunteck's own 18% net margin, the market is discounting the pipeline's profit far below even the slow-monetisation corner of the grid above.
Sources: price and NAV bridge derived above; broker sum-of-the-parts targets — Equirus ₹543, Motilal Oswal ₹530, Nuvama ₹531 — per published broker research; ₹517 is the 12-analyst consensus mean, per consensus estimates.
The outside marks
The independent NAV work agrees on direction. Four houses run explicit sum-of-the-parts or NAV valuations and land tightly together: Equirus initiated at ₹543 on a March-2026 SOTP of the residential pipeline plus BKC annuity plus a debt-free balance sheet; Motilal Oswal carries ₹530; Nuvama ₹531, trimmed from ₹560 on "MMR caution" and a rollover to a later base year. The 12-broker consensus mean sits at ₹517 (+64% over ₹315), with all twelve rated buy or strong-buy and none neutral or negative, per consensus estimates. My own conservative bridge (central ~₹440) sits below that cluster, which is the useful signal: the brokers reach ₹525–₹543 by assuming margins hold near 18–20%, monetisation is quick, and the annuity and future business development all count. Those are the assumptions the range is most sensitive to.
Why the discount could be earned
A NAV above price is not, by itself, a reason the price is wrong — the same bridge run pessimistically closes the gap, and the market may be pricing the pessimistic branch on purpose.
Watch item: at a realised post-tax margin under 12% and a monetisation slow enough to push the present-value factor below 0.40, the bridge collapses toward the ₹315 price. The ₹955 Cr the market pays for the surplus is internally consistent with a 13-year pipeline and compressing margins.
Four facts keep that branch live. The record year still earned only about 5.6% on average equity — ₹202 Cr of profit [17] against a ₹4,472 Cr net worth [18] — so nothing in the current income statement forces a re-rating. The business consumed cash to grow — FY26 net operating cash flow was negative as ₹813 Cr went into land and business development, funded by a capital raise, so the pipeline's expansion is real but self-financing it is not yet proven (Financials and Estimates). The inventory that anchors owners' equity is carried at cost, and its recoverable value is the auditor's standing key audit matter — an MMR downturn would test the net-realisable-value floor before it tests the surplus [19]. And the reported ₹266 Cr net debt is struck only after crediting back ₹386 Cr of "loans to JDA partners"; on gross debt of ₹747 Cr less ₹95 Cr cash, the balance-sheet cushion under the NAV is thinner than the 0.06x headline suggests [20].
There is also the insiders' own signal. When promoters re-upped in FY26 they priced their warrants at ₹425 — essentially the regulatory floor, not a premium (Skin in the Game). People who believed intrinsic value sat at ₹525 did not pay up to say so.
What would move the read is narrow and checkable: the realised margin on each newly launched phase (holding near 18% versus drifting toward the low-teens), the pace at which balance GDV converts to collections (compressing the 13-year run-rate), and whether operating cash flow turns positive once the FY26 land spend seasons. The pipeline is large and cheaply carried; whether it is worth ₹440 or ₹315 depends on how much of ₹41,030 Cr becomes shareholder cash, and how soon.
The Downside Floor
A value investor who demands a large margin of safety asks a different question than the asset-value work does. The pipeline case (Pipeline to NAV) measures how much a Sunteck share could be worth; this chapter measures how much stands between the price and zero. The answer is a book that is tangible, carried below market, and lightly indebted — but two facts trim the cushion. Strip the ₹861 Cr of one-year-old NCI (only ₹66 Cr of it cash) from Sunteck's ₹4,472 Cr net worth and a Sunteck share owns just ₹3,611 Cr, turning the '1.0x book / 10% of GDV' cheapness into ~1.26x owners' book with the market paying ₹955 Cr — 2.3% of GDV — for the entire development surplus. [1][2] The second is that the ₹7,896 Cr of real-estate inventory that backs the equity has never been written down.
What a share actually owns
Sunteck's FY2026 balance sheet reports total equity of ₹4,472 Cr. A Sunteck shareholder does not own that number. ₹861 Cr of it is non-controlling interest — the minority partners' share of subsidiaries the group consolidates — leaving ₹3,611 Cr of equity attributable to the owners of the holding company [3]. That distinction did not exist a year earlier: at FY2025 the group carried no non-controlling interest at all, and total equity equalled owners' equity at ₹3,260 Cr [4].
Owners' equity — FY26 (₹ Cr)
NCI — FY26 (₹ Cr)
Total equity — FY26 (₹ Cr)
The three BigValues read left to right from the query rows. Source: Q4 & FY2026 consolidated results [5].
At a market capitalisation of roughly ₹4,566 Cr, the stock trades at about 1.26x the owners' equity it actually represents, and near 1.0x the reported total. The gap between those two multiples matters: the headline "book value" flatters the per-share claim, because part of the asset base behind it is spoken for by co-investors. Book value per share on the owners' figure is about ₹246, against a price of ₹315 — so the reported accounting floor sits roughly 22% below today's price, before any judgment about whether that book is worth its carrying value.
The book is tangible, and carried below market
What makes the floor worth examining is the composition of the ₹3,611 Cr. The group carries no goodwill, and the equity is backed almost entirely by real estate. Inventory of ₹7,896 Cr is 80% of the ₹9,913 Cr asset base [6]. This is not a balance sheet padded with intangibles or acquired goodwill that would evaporate in a stress test; it is land, projects under construction, and finished flats.
Source: Q4 & FY2026 consolidated results, statement of assets and liabilities [7].
The inventory itself divides into three buckets. At FY2025 — the most recent audited breakdown — land and development rights were ₹3,017 Cr, construction work in progress ₹2,617 Cr, and finished properties ₹560 Cr [8]. The land and development rights are held at cost. The competition and NAV work established that Sunteck's land is carried at under 8% of the ₹44,100 Cr gross development value it is expected to generate — which means, for the parts of the pipeline that sell at or above cost, the book understates the economic value of the asset. That is exactly the shape a deep-asset-below-appraised-value investor looks for: a tangible book that is a conservative anchor, not a mark-to-market ceiling.
Source: FY2025 Annual Report, auditor's key-audit-matter disclosure of inventory carrying values [9].
Two things that keep the floor honest
The conservatism cuts both ways, and a careful reader should not treat "carried below market" as a guarantee. Two facts trim the cushion.
First, the ₹7,896 Cr is carried at the lower of cost and net realisable value — and it has never been written below cost. The FY2025 auditor states the policy plainly: inventory "is not written down below cost when completed flats / under-construction flats / properties are expected to be sold at or above cost" [10]. The net-realisable-value cushion that protects the carrying value is therefore management's own estimate of future selling prices and costs to complete, tested project by project, not a market appraisal. In a genuine MMR downturn — where selling prices fell below cost on specific projects — the carrying value would be impaired, and the accounting floor would move down with it. The aggregate cushion is large because land sits so far below GDV, but it is not audited to a market and it is not uniform across the portfolio.
Second, "cost" is not the same as cash out of pocket. The carrying value of inventory includes capitalised borrowing costs and allocated overheads, not just land and construction spend — a normal Ind AS treatment, but one that means the ₹7,896 Cr is a book cost, not a liquidation quote. A forced sale of half-built projects would not recover carrying value; the floor is a going-concern floor, realised through completing and selling, which is the same slow monetisation the cash-conversion work flagged (Financials and Estimates).
The ₹861 Cr that leaks out of the floor
The most consequential new fact on the FY2026 balance sheet is the non-controlling interest itself. It appeared in a single year — nil at FY2025, ₹861 Cr at FY2026 — yet the cash flow statement shows only ₹66 Cr of actual capital infused by non-controlling interests during the year [11]. The other ₹795 Cr is non-cash: it arose when the group took control of an entity it had previously equity-accounted, consolidating that entity's assets — inventory rose ₹1,690 Cr over the year — and bringing the partner's stake onto the balance sheet as NCI. The collapse in "investments in joint ventures accounted for using the equity method," from ₹233 Cr to ₹70 Cr, marks that step-up [12].
For the downside floor, the mechanism matters less than the consequence: a slice of the growing asset base is claimed by minority co-investors before it reaches the Sunteck share. When the report's asset-value scenarios credit the pipeline, they credit the consolidated whole; the owners' economic claim is the ₹3,611 Cr line, not the ₹4,472 Cr headline. The corpus does not name the specific subsidiary, the partner, or the buy-out terms — that detail sits in the FY2026 annual report, which is not yet in the file. What can be said from the audited results is bounded and specific: ₹861 Cr of net worth accrues to others, and only ₹66 Cr of it was fresh cash into the group this year.
Two things keep this from being a permanent markdown of the equity. The ₹861 Cr is not leverage dressed up as equity — it is genuine co-invested capital funding the same projects the NAV work credits, so a later buy-out of the partner on fair terms would reverse the leakage and hand the slice back to Sunteck holders. And it is new: FY2025 carried no non-controlling interest at all, so the ₹861 Cr is an FY2026 repricing of who owns the consolidated pipeline, not a structural feature that has always sat between the price and the assets.
The part that answers the bankruptcy question
For a reader whose overriding calibration is that the chance of bankruptcy be near zero, the capital structure is the reassuring part of the file — and it is reassuring for a structural reason, not just a low reported ratio. Gross borrowings across current and non-current lines total ₹774 Cr, against ₹9,913 Cr of assets — under 8% [13]. The single largest liability on the balance sheet is not debt at all: ₹3,238 Cr of "liabilities towards land owners for joint development arrangements" is the landowners' contractual share of built area, settled in kind or from project cash as projects complete — not a fixed-date, interest-bearing claim that can force a default.
Source: Q4 & FY2026 consolidated results, statement of assets and liabilities [14].
Off-balance-sheet claims are modest against that equity. At FY2025 the group disclosed contingent liabilities of roughly ₹205 Cr — ₹127 Cr of disputed income-tax demands under appeal, ₹76 Cr of claims not acknowledged as debt, and ₹3 Cr of indirect-tax matters — none of which management expects to crystallise [15]. Against ₹3,611 Cr of owners' equity, that is a rounding item. A developer with 8% asset-level debt, a going-concern land bank carried below cost-to-GDV, and no material off-balance-sheet obligations is close to the near-zero-bankruptcy profile the mandate demands.
The honest qualifier is that the low reported gearing is partly a feature of the model rather than pure conservatism. The joint-development structure pushes financing onto landowners (the ₹3,238 Cr deferred liability) and, in FY2026, onto minority co-investors (the ₹861 Cr NCI). Solvency risk is genuinely low; but the equity's effective leverage — its exposure to the projects it does not fully own or fully control the financing of — is understated by a debt-to-equity number that only counts borrowed money. The floor is real, and part of it is claimed by others.
Where the floor could move
The accounting floor — owners' equity of ₹3,611 Cr, about ₹246 a share, roughly 22% below the price — holds unless net realisable value falls below cost across a meaningful part of the ₹7,896 Cr inventory. That is the falsifiable condition: an inventory write-down in a future filing, or NRV commentary in the auditor's key-audit-matter note that flags specific projects selling below cost, would signal the floor is being tested before the pipeline surplus is. Absent that, the downside protection for this name is not the earnings — the record year still returned only 5.6% on equity — but the asset it is carried against, held below its appraised value and behind almost no debt. What a buyer gives up for that protection is spelled out in the same numbers: ₹861 Cr of the net worth, and the first claim on each completed project, belong to someone else.
The MMR Cycle
Sunteck sells into one market — the Mumbai Metropolitan Region — and that market carries two genuine tailwinds: a structural shift of share toward branded, well-capitalised developers, and a decade-long infrastructure build that is opening the peripheral corridors where most of Sunteck's volume now sits. Both are real and documented across the filings. But the sales cycle is moderating from a 2024 peak, and Sunteck's growth engine is concentrated in the mid-income segment that is the most rate-sensitive part of the market — so the pipeline's monetisation pace leans on an affordability recovery that has only just begun.
A market built for scale
The Mumbai Metropolitan Region is the largest residential market in India, and by a clear margin. In FY2025 the region absorbed 97,374 units — more than NCR (56,375), Pune (54,745) or Bengaluru (54,733), the next three cities [1]. Peer filings put MMR at roughly 30–33% of both launches and absorption across the top seven cities [2].
Source: FY2025 Annual Report, MD and A — units sold by city [3].
The demand behind that scale has been unusually broad. Nationally, residential sales rose nearly 77% between FY2019 and FY2025, with the luxury band — homes above ₹1 crore — leading the increase; within MMR, transactions in the ₹10 million to ₹50 million range have been rising as buyer mix shifts upmarket [4]. The financing plumbing has expanded alongside: gross bank credit to real estate roughly doubled from ₹17.8 lakh crore in FY2021 to ₹35.4 lakh crore in FY2025, close to 20% of all bank credit in the country, and the listed developer set raised nearly ₹400 billion of equity since 2021 — ₹76 billion of it from seven IPOs in 2025 alone [5]. A parallel office story reinforces the residential one: global capability centres leased more than 53 million square feet of Mumbai office space between 2022 and mid-2024, seeding demand for high-quality homes near the new employment nodes [6].
Consolidation toward branded developers
The most durable tailwind is not the cycle but the change in who wins the sales. A sequence of shocks — demonetisation, GST, RERA, the NBFC funding crunch, then Covid — pushed buyers away from unorganised builders who could not credibly promise delivery. By Sunteck's own citation of Anarock data, the residential market share of large, organised developers rose to roughly 40% in FY2021 from 17% in FY2017, and the shift was expected to continue [7].
Organised developer share — FY2017
Organised developer share — FY2021
Source: FY2021 Annual Report, MD and A, quoting Anarock pan-India organised-developer share [8].
MMR is where that shift bites hardest. Because Maharashtra implemented RERA earlier and more completely than most states, the region's market is more structured and corporatised than its peers — an environment that rewards developers who can fund construction to completion and carry a brand [9]. This is the industry fact that most directly supports Sunteck's low-leverage, in-house-construction model documented elsewhere in this report: a near-zero-net-debt balance sheet is not just prudence, it is the entry ticket to the share that is migrating away from stressed builders. The counter-point is that the same logic favours every large listed peer — Lodha, Godrej, Oberoi, Rustomjee — and Sunteck is a small player within that cohort, so consolidation is a rising tide it shares rather than a moat it owns.
Infrastructure as the demand map
The second structural driver is physical: a multi-line metro build, the Coastal Road, the Atal Setu sea link across Mumbai harbour, and an upcoming high-speed rail terminus are compressing commute times and pulling demand into corridors that were previously too remote to command a premium [10]. Metro Line 3's underground corridor connecting Colaba, BKC, Worli and the airport is now operational, and Phase 1 of the Coastal Road and the Atal Setu are complete [11]. Lodha frames the macro that sits under it: MMR carries roughly a US$140 billion GDP and about US$5,500 per-capita income today, and Maharashtra's stated roadmap to double state GDP toward US$1.5 trillion by 2047 is projected to lift MMR per-capita income to nearly US$10,000 by decade-end — a multi-decade, not multi-year, demand base [12].
The value of that build to Sunteck depends on which corridors it has already bought into. The pipeline maps almost one-for-one onto specific infrastructure catalysts.
Source: FY2025 Annual Report, MD and A — project and micro-market detail [13] [14].
At the top of that table, BKC is a scarcity story: developed by MMRDA into the country's foremost corporate address — home to the National Stock Exchange and SEBI — with chronically thin residential supply, which is what lets Signature Island and Signia command uber-luxury pricing [15]. Further out, ODC-Goregaon is a price-appreciation story: Sunteck's management expects property values there to rise 30–40% over the next three to four years as the micro-market matures into an integrated township [16]. But the bulk of the unit count — Naigaon, Vasai, Mira Road, Kalyan — is aspirational-luxury and mid-income township product, and that is where the cycle question lives.
The cycle is moderating
The multi-year demand base is intact, but the sales cycle has turned down from its 2024 peak. Independent peer data captures it cleanly: across India's top eight cities, FY2026 launches fell about 4% and sales about 2% year on year, and within MMR the moderation was sharper — launches down 10% and sales down 2%, to 95,443 units from 97,374 [17]. That follows a 2025 that was itself a peak, with MMR sales up roughly 11% to about 96,000 units [18].
Source: Kolte-Patil FY2026 Annual Report, MD and A, city-wise launches and sales [19].
The moderation is orderly rather than a downturn. Unsold MMR stock actually fell 6% year on year to 155,604 units at the end of 2025, leaving a balanced quarters-to-sell metric of 6.4 — a market absorbing supply and holding price, not one choking on inventory [20]. Sunteck's own read is consistent: management describes a market poised for "steady, end-user led growth in the near term, even as headline numbers moderate from previous peaks," and credits recent RBI rate cuts with sustaining momentum [21].
Where Sunteck sits in the cycle
The company brands itself around the ultra-premium end, but its volume growth is powered by the opposite end of the market. Naigaon, Vasai, Mira Road and Kalyan are aspirational-luxury and mid-income townships [22], and that is precisely the segment Lodha identifies as having "borne the brunt of tighter monetary environment over the past four years," now expected to recover as lower borrowing costs improve affordability [23]. The read that best fits the evidence: Sunteck's five-year pre-sales record is riding an affordability-and-connectivity cycle in the western and peripheral MMR corridor more than a scarcity premium at BKC — a real tailwind, but one geared to interest rates. The BKC leg protects margin and brand; the townships supply the growth.
That framing carries its own counter-fact. The mid-income tilt cuts both ways: the RBI easing that Lodha and Sunteck both cite is a genuine catalyst for exactly Sunteck's volume segment, so the same rate-sensitivity that is a risk in a tightening cycle is a tailwind in a loosening one — and the cycle is currently loosening [24]. What would change the read is narrow and observable: the pace at which the peripheral townships convert launches into collections, and whether the rate-cut cycle holds long enough for the mid-income recovery to arrive. Those are the same monetisation-speed variables the pipeline valuation is most sensitive to — the industry backdrop supports the pace the NAV assumes, but only if the affordability recovery that has just started continues.
Scale and Margin
The premium brand does not translate into premium economics. Against six listed Mumbai-region peers, Sunteck's FY2026 net margin of 18% is mid-pack — below Oberoi (42%), Godrej (36%) and even volume leader Lodha (21%) — and its 5.6% return on equity is the second-lowest of the profitable peers, above only Rustomjee's 3.3%. The one advantage prior chapters called a fortress — a near-debt-free balance sheet — has become sector-wide, not a Sunteck edge. The 18% margin the appraisal leans on is defensible, but it is not a moat.
The peer set, and the size of the gap
The six developers the filings and broker screens group with Sunteck run the same model — build and sell residential units in the Mumbai Metropolitan Region (MMR), with an annuity tail — so the comparison is like-for-like. What is not like-for-like is size. Sunteck booked ₹3,157 crore of pre-sales in FY2026, up 25% and its fifth straight record [1]. Lodha booked ₹205 billion — ₹20,500 crore — and its MMR sales alone (~₹160 billion) were roughly five times Sunteck's entire national total [2]. Godrej Properties booked ₹34,171 crore, the largest by any Indian developer for a third year running [3].
On recognised revenue — the accounting measure, lagged behind bookings by the percentage-of-completion method — Sunteck sits second-smallest of the seven.
Source: derived from each company's FY2026 reported financials (consolidated); Sunteck ₹1,124 crore per Q4 FY2026 investor presentation [4].
Scale is not itself a moat, but it shapes the two things that are: unit cost and the ability to spread land bets across cities and cycles. Lodha makes the point directly — its ₹205 billion of pre-sales was "delivered across ~40 locations within the MMR, Pune and Bengaluru," a spread it argues insulates its revenue "from dependency on any particular project, micro market or city" [5]. Sunteck's book is concentrated in a single region and a handful of large townships. That concentration is the flip side of the MMR Cycle point: a rate-geared, single-market pipeline carries more cyclicality than a diversified one.
Margin is mid-pack, not premium
The bull framing — that a city-centric luxury brand should command pricing power — implies a margin above the field. The numbers do not show one. Sunteck's 18.0% net margin and 27% EBITDA margin [6] sit in the middle of the cohort: below Oberoi's 42% and Godrej's 36%, below Lodha's 21% net (and Lodha's ~34% adjusted EBITDA margin [7]), and above only the two developers working through trouble, Ajmera and Rustomjee.
Source: derived from each company's FY2026 reported financials (consolidated); Kolte-Patil ran a net loss and is omitted.
Two of those marks need a caveat before they anchor anything. Godrej recognises revenue on only a sliver of its bookings — ₹5,131 crore of accounting revenue against ₹34,171 crore of sales — because most of its projects sit in SPVs whose profits are not consolidated, so its 36% is struck on an unrepresentative base [8]. Oberoi's 42% is the more instructive comparison, because Oberoi is the genuine premium-Mumbai developer and its margin is real and durable — it has held above 40% for three years. The difference is the land. Oberoi buys land outright — freehold rights, acquisitions, redevelopment — and keeps the whole development surplus [9].
Sunteck's model is the opposite by design. It leans on joint-development agreements and redevelopment — an asset-light approach it says it applies "against stringent margin thresholds" [10]. Under a JDA the landowner takes a share of constructed area, so Sunteck recognises only its own slice of each project's value — the structural reason a premium brand earns a mid-pack margin. That is a deliberate trade: less capital tied up in land, at the cost of the top-tier margin an owned-land developer keeps. It is not evidence of pricing power, and the appraisal in Pipeline to NAV already assumes this ~18% level rather than an Oberoi-like one — so the peer read supports that chapter's central case and undercuts its optimistic corner.
Returns lag most of the profitable cohort
Margin is what Sunteck keeps per rupee of revenue; return on equity is what it earns on shareholders' capital, and here the gap is starker. Sunteck's 5.6% ROE in a record year is the second-lowest of the profitable cohort, above only Rustomjee's 3.3% — less than half Godrej's 9.6%, and a third of Lodha's 14.7% and Oberoi's 14.0%.
Source: derived from each company's FY2026 reported financials (consolidated); Rustomjee (3.3%) is profitable and sits just below Sunteck; Kolte-Patil ran a net loss and is omitted.
The mechanism is the one the Financials and Estimates and NAV chapters flagged: Sunteck carries a large pipeline — over 50 million square feet, ₹41,030 crore of gross development value — as inventory at cost, and turns it slowly. Asset turnover was 0.11x in FY2026. Equity keeps growing (helped by the ₹500 crore warrant raise), while recognised profit lags the pace at which land is bought and inventory built. A big balance sheet earning a small return is precisely what a ~5.6% ROE describes. The asset-light JDA model is supposed to earn that capital back faster than an owned-land peer; on FY2026 numbers it does not yet — Oberoi, carrying far more owned land, still earns 2.5 times Sunteck's ROE.
The full picture, in one place:
Source: derived from each company's FY2026 reported financials (consolidated). Sunteck's gross debt/equity understates its position — reported net debt/equity is 0.06x [11].
The balance sheet is strong, and no longer rare
Prior chapters rested part of the bull case on Sunteck's near-debt-free balance sheet — reported net debt/equity of 0.06x [12]. It is genuinely conservative. It is also, on FY2026 numbers, no longer a differentiator. Every large peer in the cohort carries gross debt/equity between 0.00x and 0.16x — Kolte-Patil at zero, Godrej 0.12x, Oberoi 0.13x, Lodha 0.16x. Only Ajmera, at 0.48x, is meaningfully levered. India's post-RERA cycle rewarded low leverage across the board, so the whole branded cohort deleveraged together; Sunteck rode that tide rather than standing apart on it.
The same holds for the other operational strengths. In-house construction, a disciplined land desk, a recognisable brand in western MMR — these are real, and they are why Sunteck survived the sector's shakeout. But a well-funded competitor can and does replicate each, so none of them confers a lasting edge. What a moat needs is a number a rival cannot match — a durable margin, share, or return premium — and Sunteck posts none: mid-pack margin, bottom-of-cohort return, single-region scale.
The margin the appraisal assumes
On the evidence, Sunteck's competitive position is a competent, conservatively financed small player with no demonstrated pricing or scale moat — narrow at best, and not the kind that would justify a re-rating toward premium-peer multiples on its own. The strongest fact the other way: Sunteck's pre-sales are growing faster than most of the cohort (25% in FY2026, a fifth straight record), and management targets ₹5,000 crore of bookings, so part of today's low ROE is a small base scaling up rather than a permanent ceiling — if collections follow bookings, asset turnover and ROE rise mechanically.
The read that survives both facts: the ~18% margin the Pipeline to NAV appraisal assumes is defensible, because it is roughly what Sunteck earns and it sits mid-cohort, not at an aspirational edge — the peer set validates the base case and argues against the appraisal's optimistic corner. What it removes is the premium-moat leg of the bull story. The evidence would shift if realised margin on the scaling mid-income townships held at 18% while pre-sales pushed past ₹5,000 crore and ROE climbed toward the low teens — turning the current discount from earned into an inflection. Until the returns move, the discount to the cohort's ROE is the metric that most directly reflects the market's caution.
Promise and Delivery
Management's near-term pre-sales guidance has proved reliable: four straight years of 20–32% growth, each landing inside the range set at the year's start. Its larger milestones have not. The "double every 2–2.5 years" cadence has run closer to 3.5 years, the ₹50,000–60,000 Cr GDV target and the Dubai launch remain outstanding, and the promised collections inflection has been deferred three years running. The record supports the booking number, while the timeline for the cash it becomes has slipped repeatedly.
The annual number, delivered
For a company whose stock has gone nowhere for fifteen years, the most useful test of management is narrow and checkable: whether the pre-sales it guided to at the start of each year actually arrived. On that test the record is clean. In early 2023 the company framed a target of "around 20%" annual pre-sales growth, on a 22% CAGR base through the prior cycle [1]. It has cleared that bar every year since.
Source: full-year figures reported on each Q4 earnings call — FY2022–FY2023 [2], FY2024 [3], FY2025 [4], FY2026 [5].
Pre-sales ran ₹1,602 Cr in FY23 (+23%) [6], ₹1,915 Cr in FY24 (+20%) [7], ₹2,531 Cr in FY25 (+32%) [8], and ₹3,157 Cr in FY26 (+25%) [9]. Management's own framing of the FY26 result — "this strong performance reaffirms the guidance we had shared at the start of the year" — is, for once, accurate [10]. A four-year record of guiding to a growth rate and hitting it is worth crediting; it is the reason the pre-sales line, on its own, reads as a genuine operating inflection rather than a story.
Where the timeline slips
The credibility gap opens on the larger, dated commitments. In November 2022 the company set two more specific goals: to "double our presales every 2 to 2.5 years," and, concretely, to "reach the presales of close to 2,500 crores" by FY24 [11]. Neither held to schedule. FY24 pre-sales came in at ₹1,915 Cr — roughly ₹585 Cr, or 23%, short of the ₹2,500 Cr milestone [12]. The ₹2,500 Cr level was not cleared until FY25, a year later than promised [13]. Measured end to end, pre-sales rose from ₹1,303 Cr in FY22 to ₹3,157 Cr in FY26 — a genuine 2.4x, but one that took four years, a doubling cadence nearer 3.5 years than the promised 2 to 2.5.
The GDV target tells the same story, with the goalpost moving as it slips. In November 2023 the pipeline was framed at "close to Rs. 30,000 crores," with a plan to "grow this portfolio from Rs. 30,000 crores to Rs. 50,000 crores" over "2 years to 3 years" [14]. Three months later the same ambition was restated as "doubling our GDV… from INR30,000 crores to INR60,000 crores in the coming years" [15]. As of the FY26 close, GDV stood at ₹44,100 Cr [16] — real progress from ₹30,000 Cr, but short of both the ₹50,000 Cr and ₹60,000 Cr markers, with the horizon quietly stretched from "2–3 years" to "the coming years."
Then there is Dubai. The "Burj Khalifa Community" plot next to Dubai Mall has been described as "launch-ready" across successive calls, yet remained unlaunched at the FY26 results, now attributed to the regional conflict: "the project is launch-ready for us. And whenever we see the event settling down… we will be looking forward to launch the project as soon as possible" [17]. Smaller launches have slipped on the same pattern — of Borivali, in early 2024, management "won't be confident that whether we'll be able launch in FY'25" [18]. None of this is a broken promise so much as a consistently optimistic clock: the projects are real, the dates are not.
Source: management commitments and outcomes as reported on the earnings calls cited throughout this chapter [19] [20].
The cash-conversion promise
One slipped commitment carries more weight than the others, because it is the mechanism behind the low return on equity the earlier chapters isolated. For three years running, management has told analysts that collections — the actual cash coming through the door — would jump to match the pre-sales it keeps booking. Guidance entering FY26 was for pre-sales "growth of more than 30%" and, explicitly, "some similar growth we can look at the collections also" [21]. That is not what happened.
Source: derived from reported full-year pre-sales and collections, FY2022–FY2026 earnings calls [22] [23].
Collections have been effectively flat while bookings have compounded: ₹1,052 Cr in FY22, ₹1,250 Cr in FY23, ₹1,236 Cr in FY24, ₹1,255 Cr in FY25, and ₹1,433 Cr in FY26 [24] [25] [26] [27]. Over FY22–FY26 pre-sales grew at roughly a 25% CAGR while collections grew at about 8%, and cash collected fell from 81% of what was sold to 45%. On the FY26 call an analyst put the gap to management directly — collections "grew 14% Y-o-Y. Significantly lower than the sales growth of 25%… collection as a percentage of sales also… it's less than 50%" — and the answer was, again, deferral: "FY '27 and FY '28 you will see a very, very strong cash flow" [28].
The counter-fact deserves equal weight, because the lag is partly structural rather than a failure. Sunteck sells on construction-linked plans, and its biggest bookings sit in early-stage JDA townships and in possession-linked uber-luxury inventory at BKC and Nepean Sea Road, where cash arrives only as slabs rise or keys change hands. The receivable is contracted, not lost — as of late 2023 the company carried "around Rs. 2,250 crores" of "receivables from sales booked" that "will come as we progress with the construction" [29]. And FY26 showed the first sign of the promised turn: collections finally grew 14%, with Q4 collections up 39% to ₹432 Cr [30]. What the record establishes is not that the cash will never come, but that the timing of it is the number management has repeatedly guided to and repeatedly missed — the same lever the pipeline valuation is most sensitive to and the direct source of the 5.6% return on equity documented in Scale and Margin.
What the record implies
On the evidence, this is a management team that executes the controllable and over-promises the discretionary. The near-term sales machine is credible and should be taken close to face value; the pipeline expansion is real if slower than advertised; and the balance-sheet discipline is genuine — net debt held at 0.06x even as FY26 business-development spend jumped to ₹810 Cr from ₹180 Cr the year before [31]. The commitment least safe to take on management's timeline is the collections inflection, precisely because it is the one that converts the record profits into distributable cash.
The read would tighten in the company's favour if FY27–FY28 collections growth actually closes on pre-sales growth — management's own stated test — and if Dubai either launches or is removed from the headline GDV rather than carried as perpetual optionality. It would weaken if collections stay in the low-teens of growth while bookings compound, because a widening sold-but-uncollected gap is how a builder can post record pre-sales and record profit for years while the equity earns a mid-single-digit return.
Scenarios and Triggers
The asset-value case and the fairly-earned case run from the same numbers: a market capitalisation near ₹4,566 Cr, a central net-asset value around ₹440 a share, a 5.6% return on equity in a record year, and collections at 45% of pre-sales. What divides them is two variables the corpus cannot yet settle — the margin Sunteck realises as its pipeline is built, and how quickly bookings become cash. This chapter frames both as scenarios and lists the FY27–FY28 line items that will decide which one holds.
One set of facts, two readings
A reader who has followed the earlier chapters has met both cases in full. The pipeline-to-NAV bridge converts the ₹41,030 Cr balance pipeline [1] into roughly ₹440 a share against a ₹315 price; the cash-conversion record shows collections growing at about 8% a year while pre-sales compound at ~25%, and management deferring the promised inflection three years running [2]. Neither side disputes the other's facts. They weight the same evidence differently, and the difference resolves into a small number of levers.
Sources: balance GDV and NAV bridge, Pipeline to NAV, on the Q4 FY2026 presentation [3]; collections and deferral, Promise and Delivery and Q4 FY2026 call [4]; warrant terms, Skin in the Game and the FY2026 preferential-issue notice [5].
The two levers are not independent. A higher realised margin lifts every NAV corner; a faster sell-down does the same by shortening the discount period. Both feed the figure this report keeps returning to: the cash that record bookings eventually become. Management's own framing on the FY26 call ties the two together: better margins ahead "because the prices have gone up" and the historic book was sold cheaper [6], alongside a repeated promise that "FY '27 and FY '28 you will see a very, very strong cash flow" [7].
Three scenarios
On a disciplined bridge, Sunteck's ₹41,030 Cr pipeline is worth roughly ₹440 a share (range ₹365-₹538) against a ₹315 price, so the fallen-star discount is real but far narrower than the raw 10%-of-GDV framing suggests. The scenarios below are the corners of the NAV grid built in Pipeline to NAV, attached to the levers above rather than new marks. They are illustrative, not forecasts: each pairs a realised post-tax margin and a sell-down pace with the per-share value that bridge produces, cross-checked against the ₹315 price and the ₹517 consensus mean target.
Source: NAV grid corners and broker sum-of-the-parts (₹525–543), Pipeline to NAV; consensus mean target ₹517 from covering analysts, as reported.
The grid is skewed to the upside around today's ₹315: the price already discounts a genuinely poor outcome. The base case is not the price — it is about 40% above it — but the fairly-earned corner is not a crash either; it is a company whose ₹315 quote already discounts a sub-12% margin and a slow sell-down, internally consistent with the 5.6% ROE. The fallen-star corner needs two things to go right at once: the ~18% net margin the NAV leans on must hold as the mix tilts toward mid-income townships (the scale-and-margin constraint), and the cash must arrive faster than the last four years suggest. Neither is disproved; neither is yet delivered.
Dubai sits outside this grid on purpose. The ₹6,000–7,000 Cr of GDV management expects to launch in FY27 excludes it [8], and the project has been "launch-ready right now" through successive calls while remaining unlaunched, most recently paused on the Middle East conflict [9]. Sunteck has put roughly AED130 million into a 50% economic interest it values at multiples of cost [10], but on management's own marks, not an arm's-length transaction. Until it launches or is removed from the headline pipeline, it belongs in the bull corner as optionality, not in the base.
What to watch
Each signal below is a line item in a specific filing, with the FY2026 baseline and the threshold that would move the read from one scenario toward another. All are checkable within the next four to six quarters.
Sources: collections and OCF, Promise and Delivery and Q4 FY2026 call [11]; One World delivery [12]; the ₹552 Cr "Net Cash Flow Surplus" is struck before ₹813 Cr of business-development spend [13]; warrant terms [14]; EPS estimates as reported.
Two of these carry more weight than the rest. The collections ratio is the direct mechanism behind the 5.6% ROE, and it now has a concrete near-term catalyst rather than another verbal promise: Sunteck One World in Naigaon is scheduled for delivery in FY27, at which point revenue recognition and ready-inventory collections should follow [15]. That is the strongest fact against reading the three-year deferral as permanent. Set against it, the same management has guided a collections jump in three consecutive years and missed each time, and its FY27 pre-sales guidance of "similar growth of 25%" [16] keeps the numerator of that ratio climbing — so the ratio only improves if collections finally grow faster than bookings, which they have not done since FY2022.
The margin lever is quieter but larger. Management guides a blended 35–40% EBITDA margin, and no worse than 30–35% on new acquisitions [17]; the NAV bridge uses an ~18% net margin after interest, tax and overhead, which is consistent with that guidance but leaves little room if the mid-income tilt or flat pricing — management expects "not too much of price rise from here" [18] — compresses it. A realised margin a few points either side of 16% moves the base case by more than the collections timing does.
What would decide it, then, is not sentiment about a fifteen-year-flat stock but two reported numbers over the next two years: whether cash collected finally converges toward what is sold, and at what margin the pipeline is actually realised. The evidence today supports the base case — an asset trading somewhat below a disciplined appraisal, held back by a real cash-conversion problem — with the fairly-earned corner alive as long as collections stay below half of pre-sales, and the fallen-star corner reserved for the reader who is willing to underwrite both a margin hold and a monetisation that has not yet happened.