Sunteck Realty Limited's management explains the business in its own materials. The slides below do the most of that work, pulled from the documents preserved in Sources. Each source link opens the complete presentation at that slide in a new tab.
Management's fullest current statement of the business: MMR luxury-housing model, land bank, cash generation and balance sheet, all in one deck. · Open the full document →
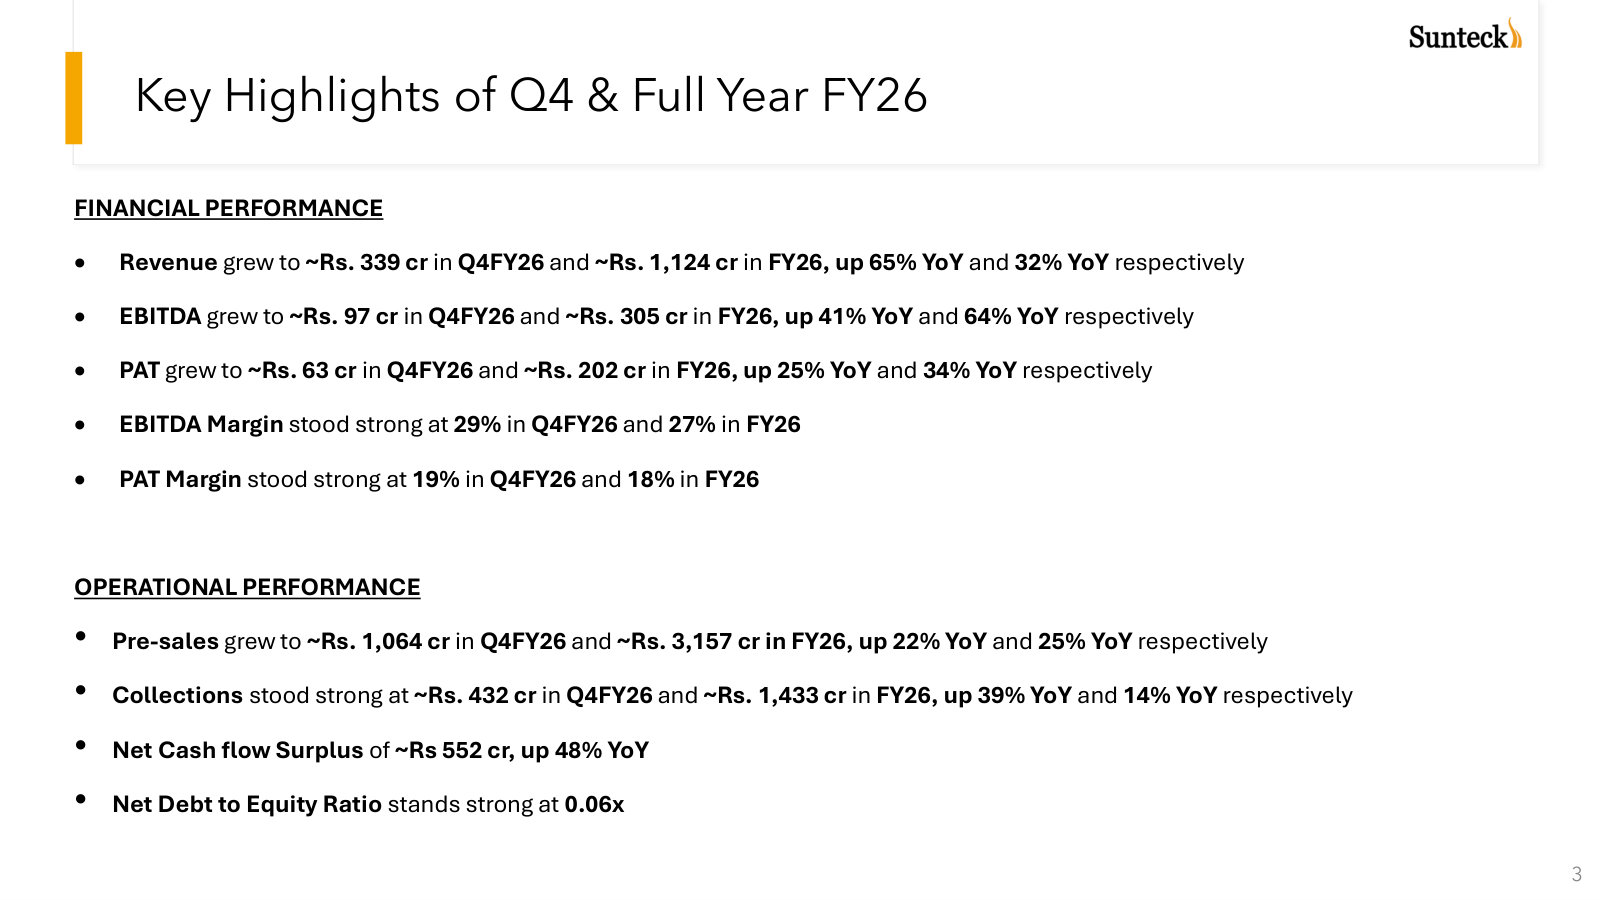
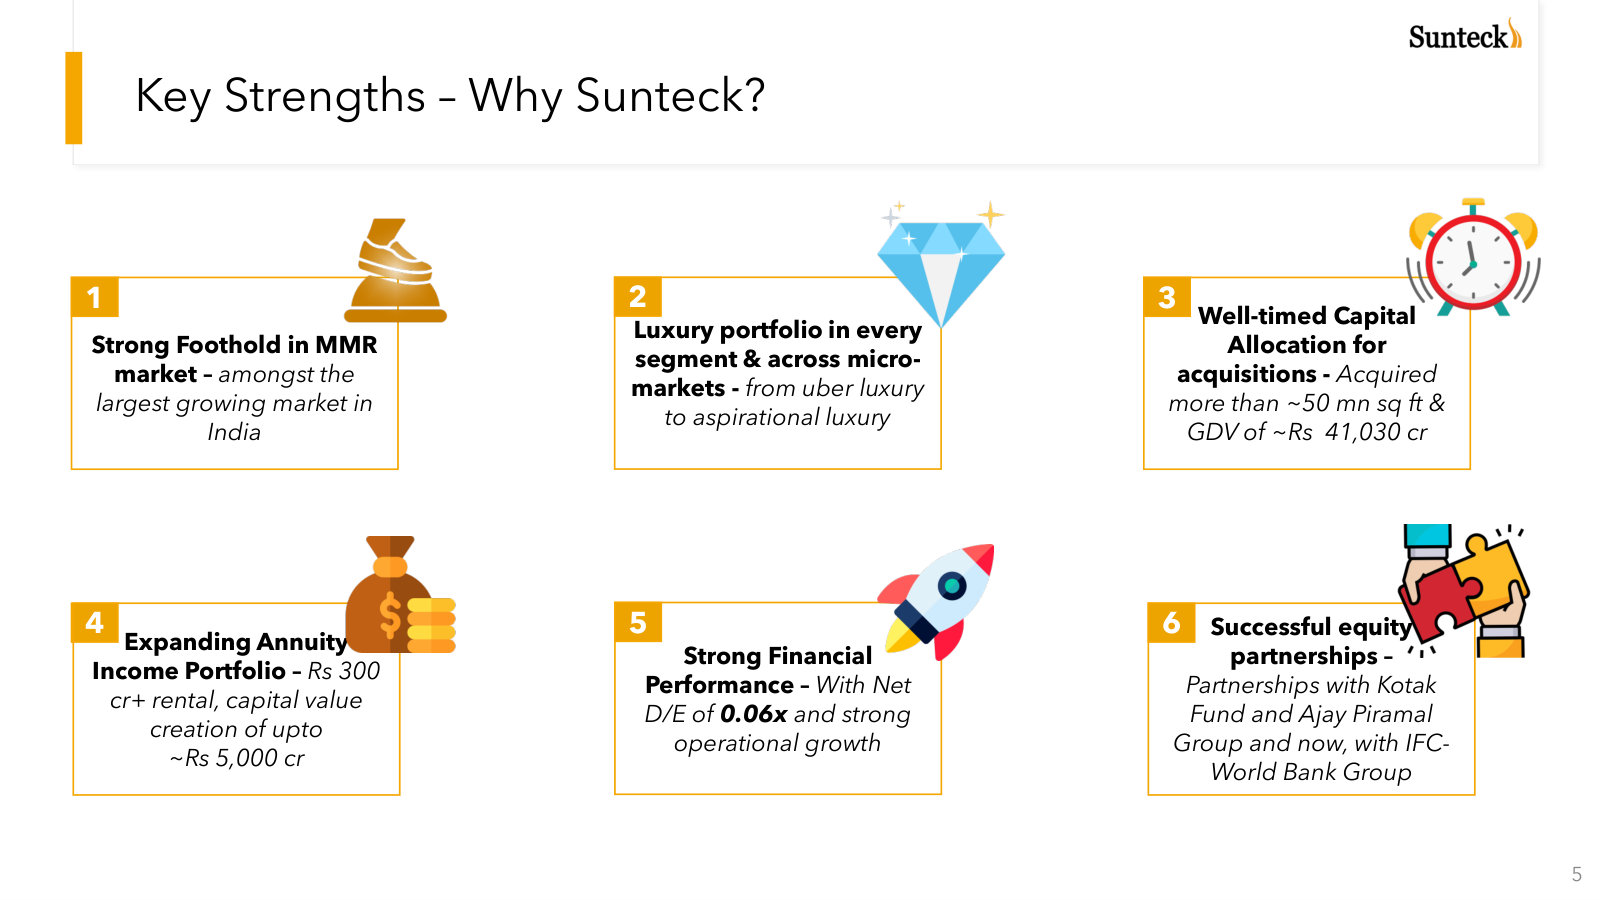
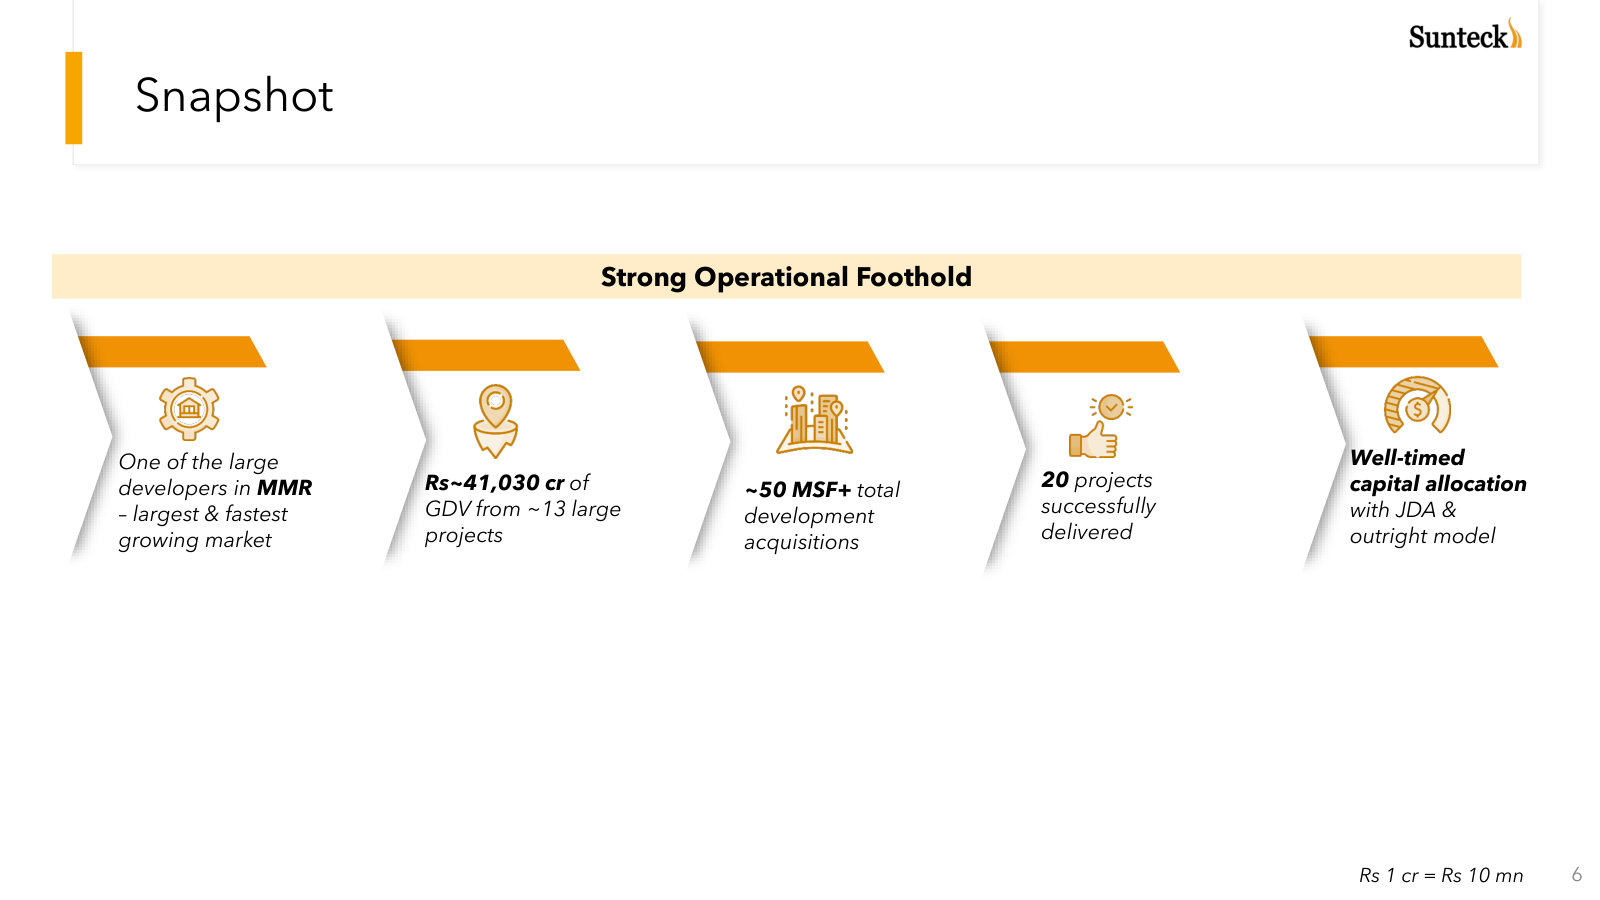
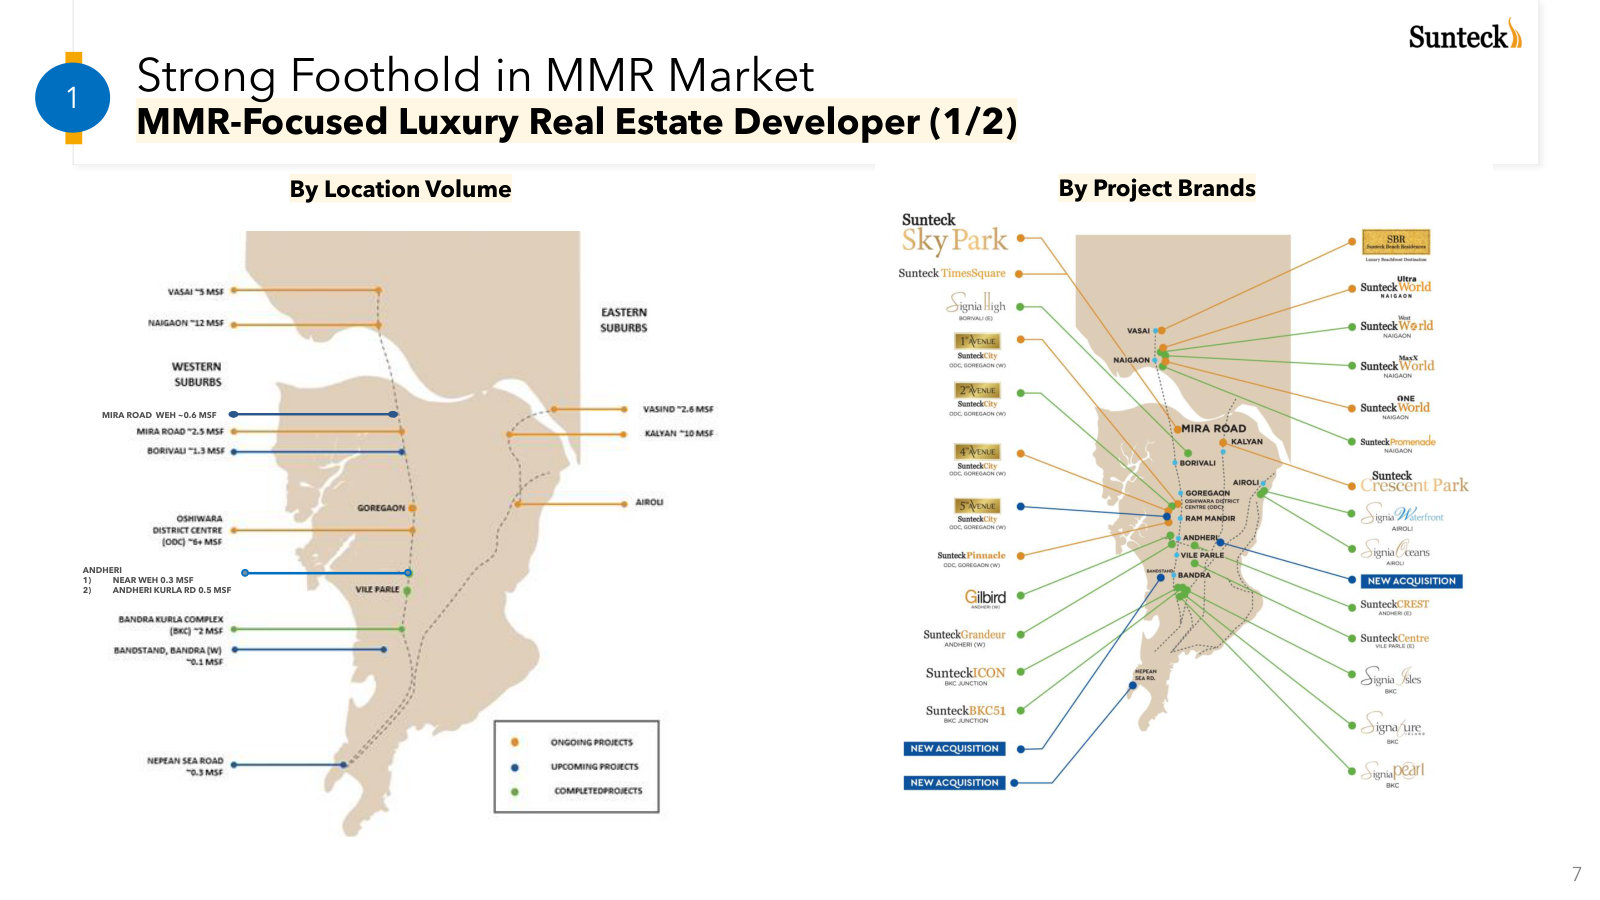
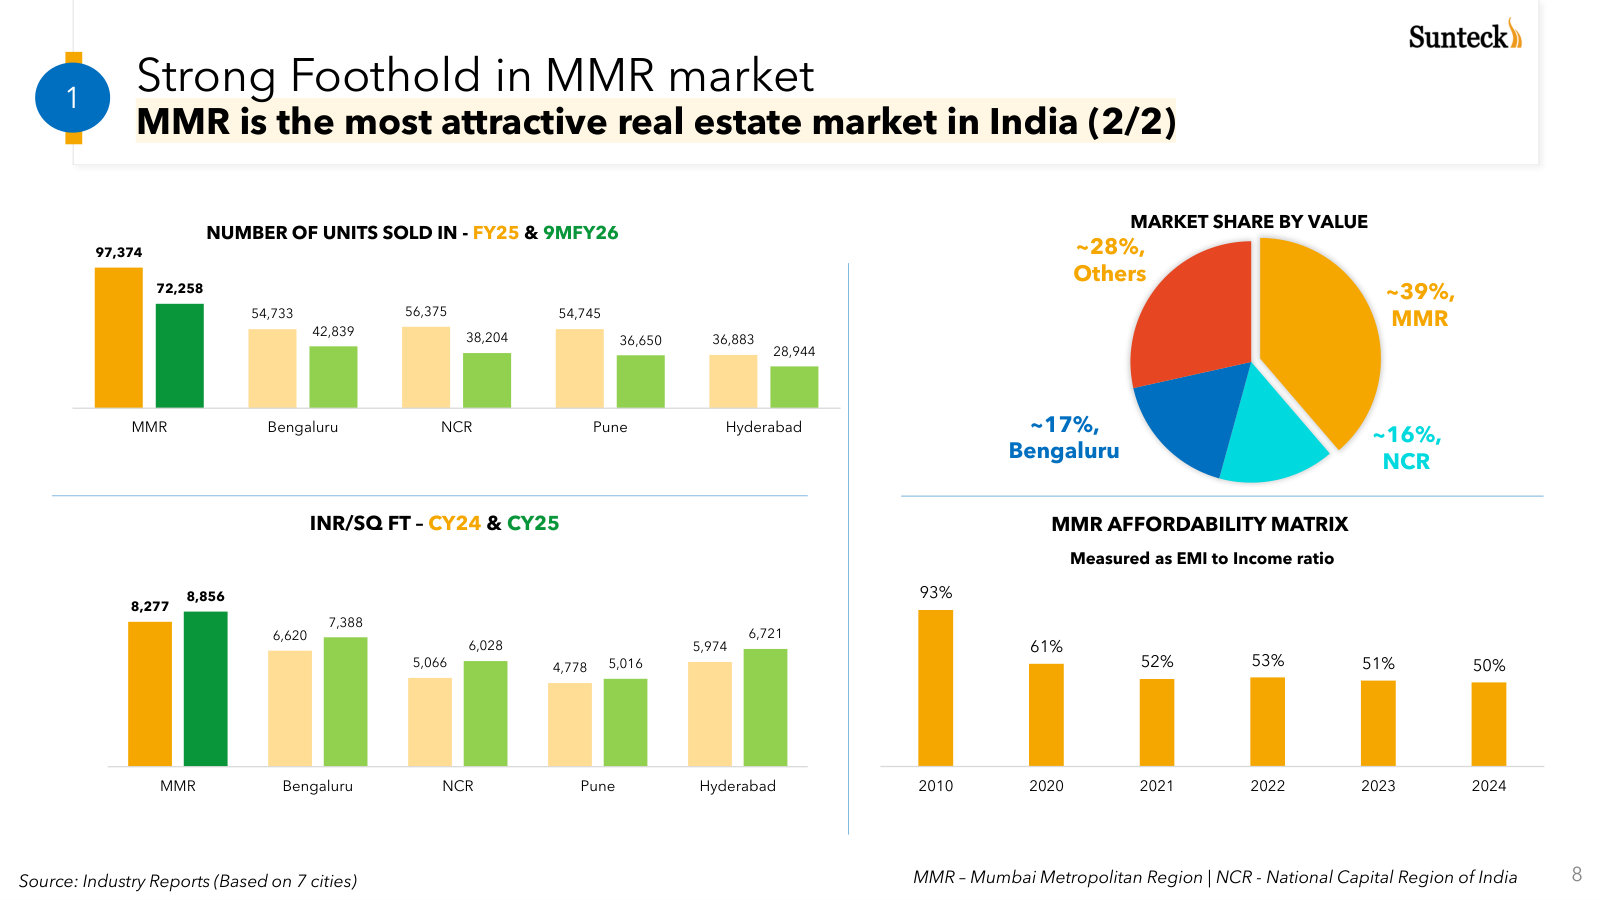
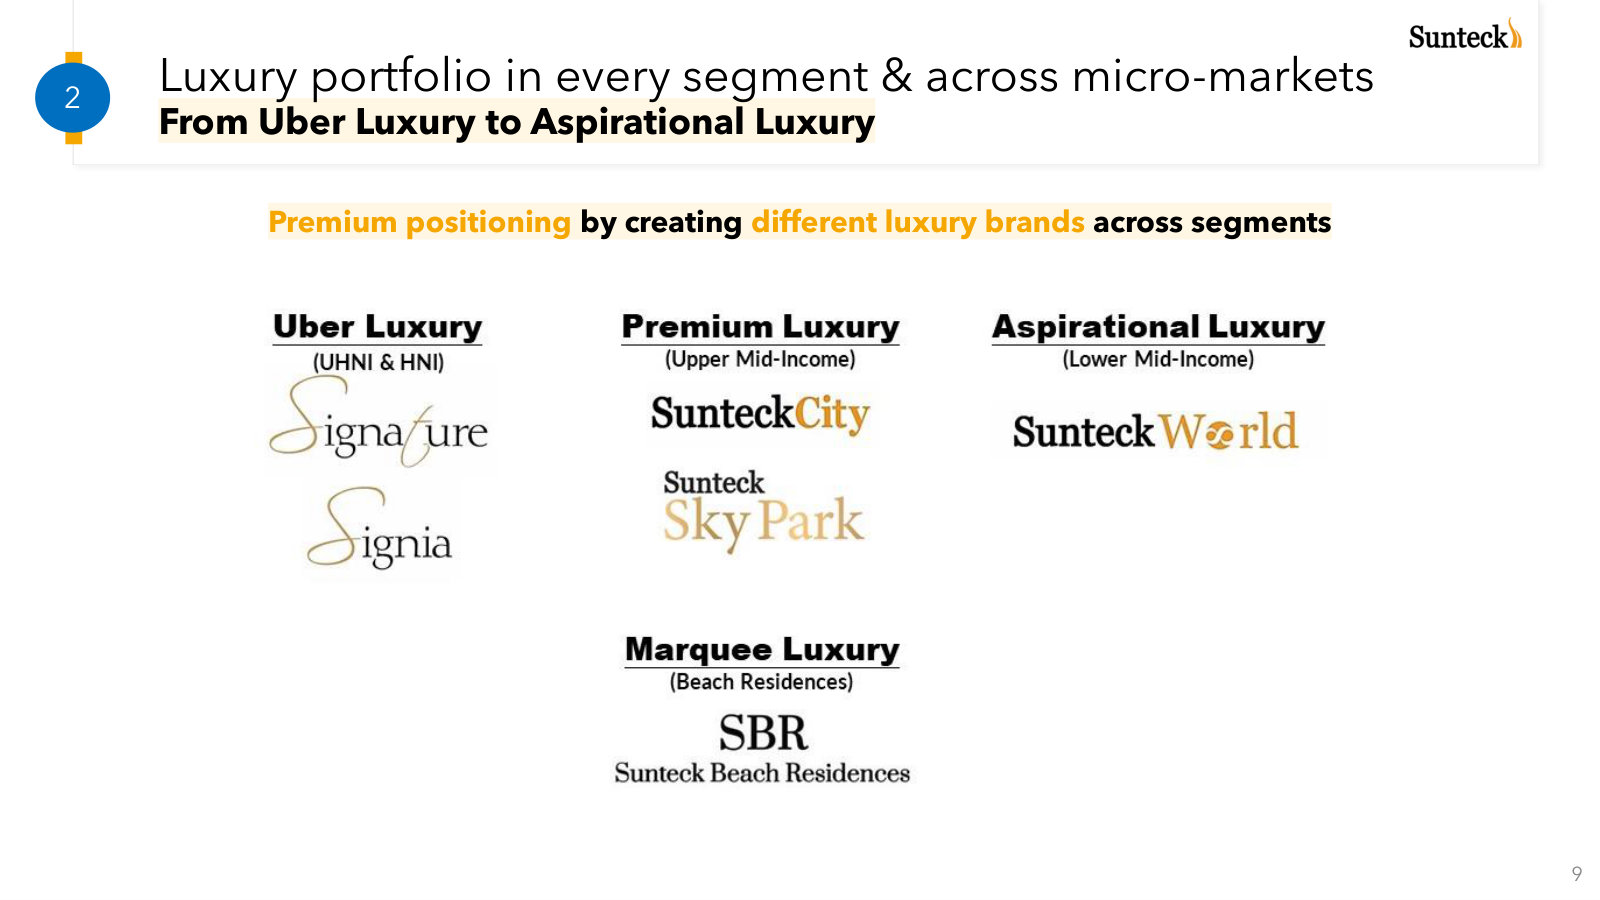
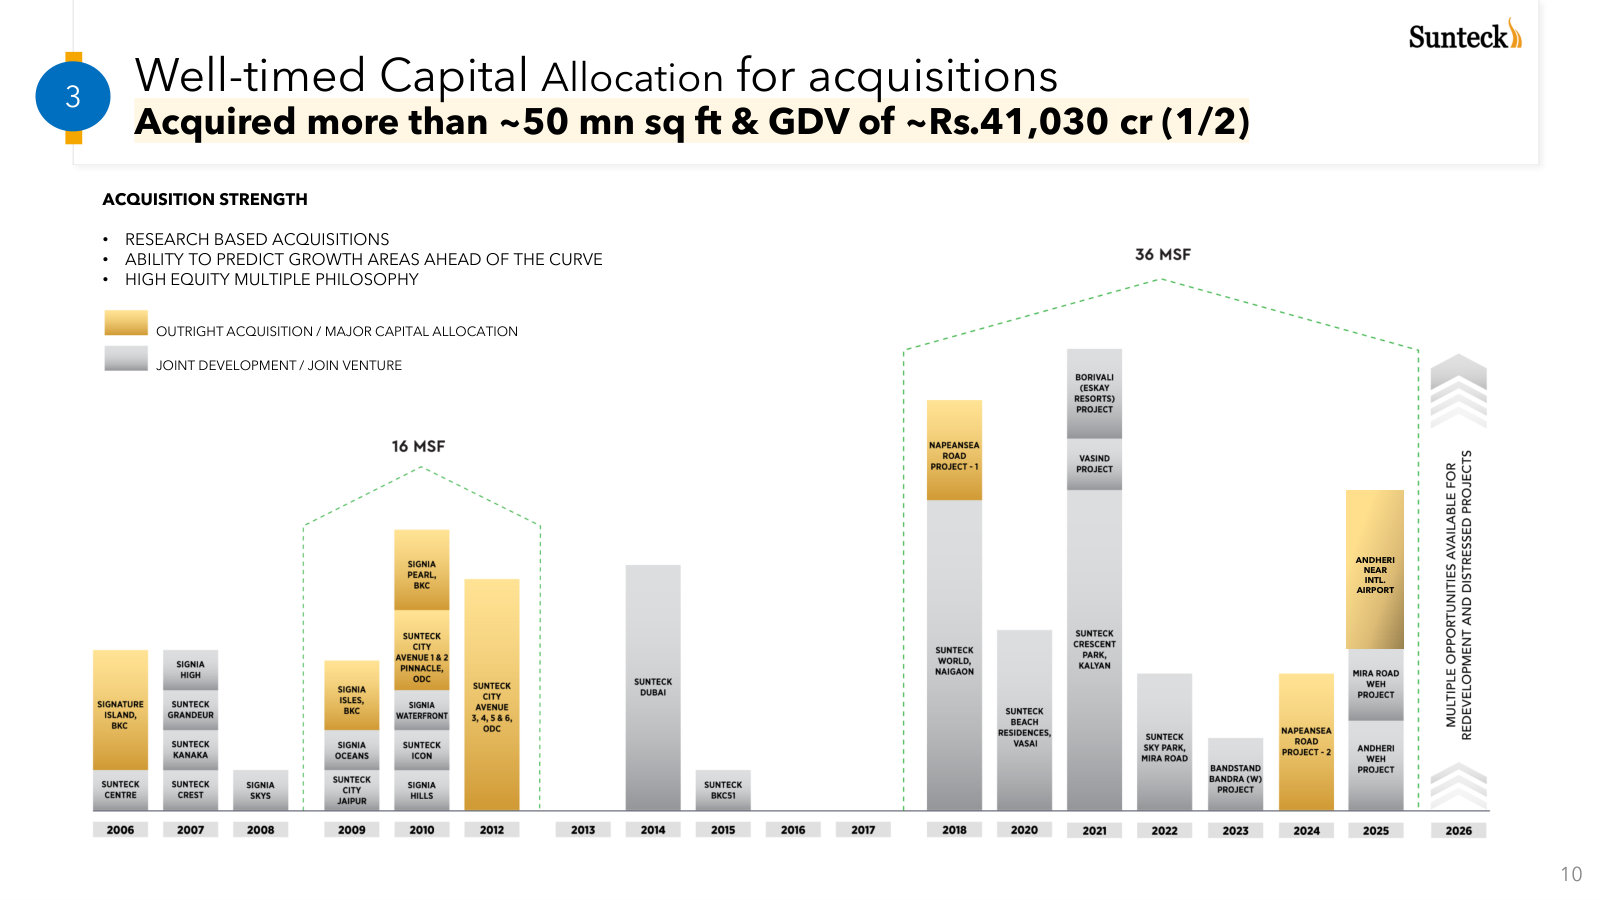
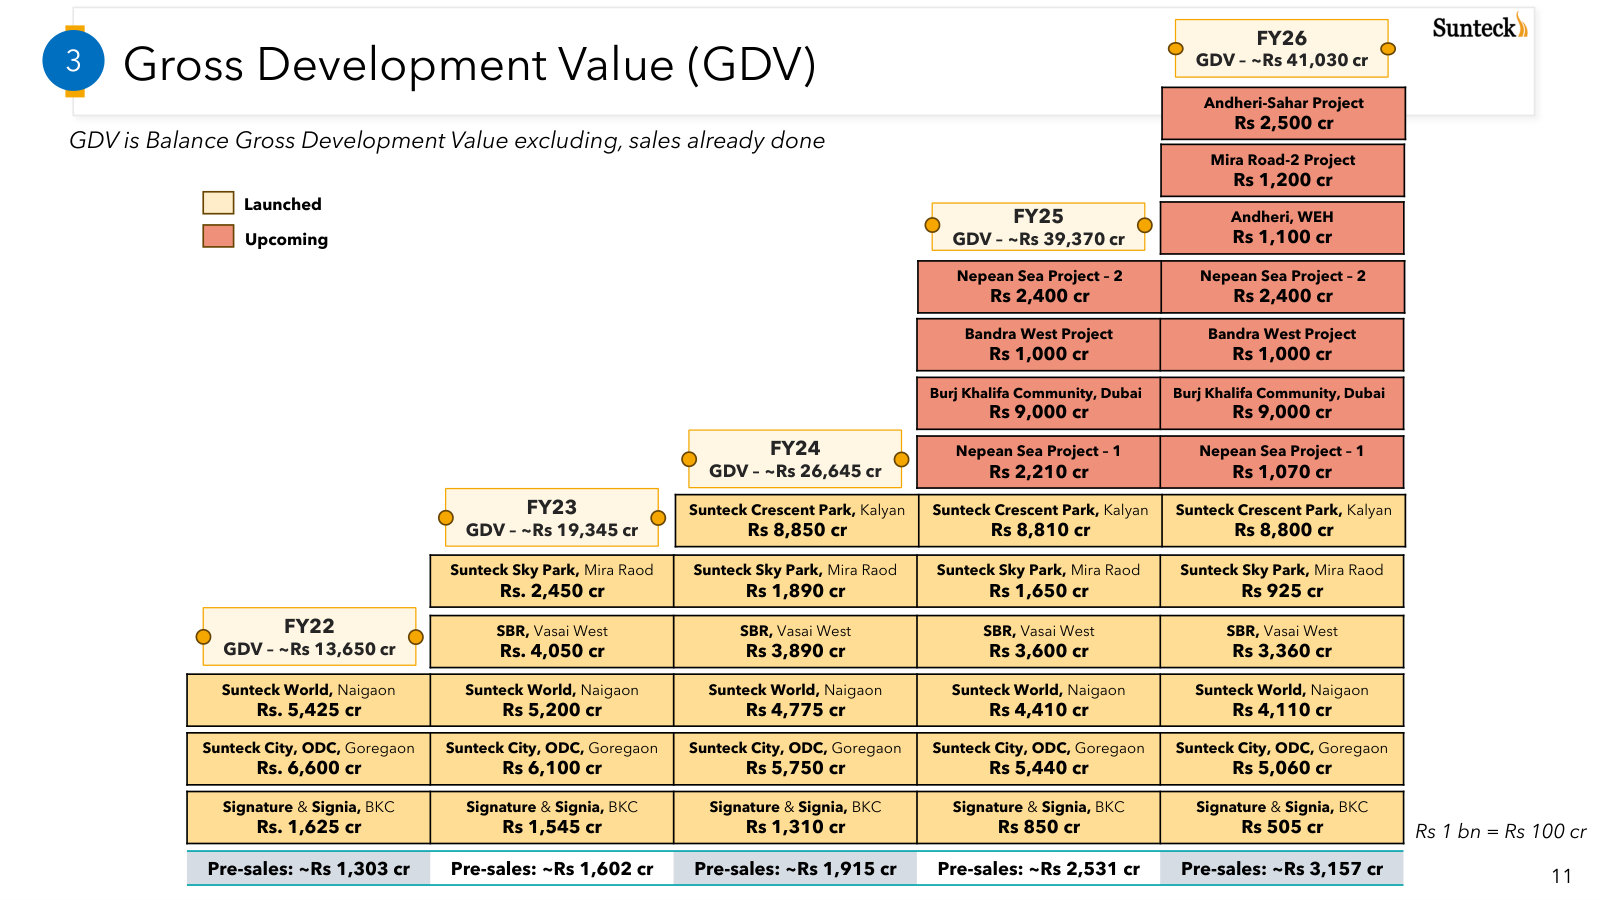
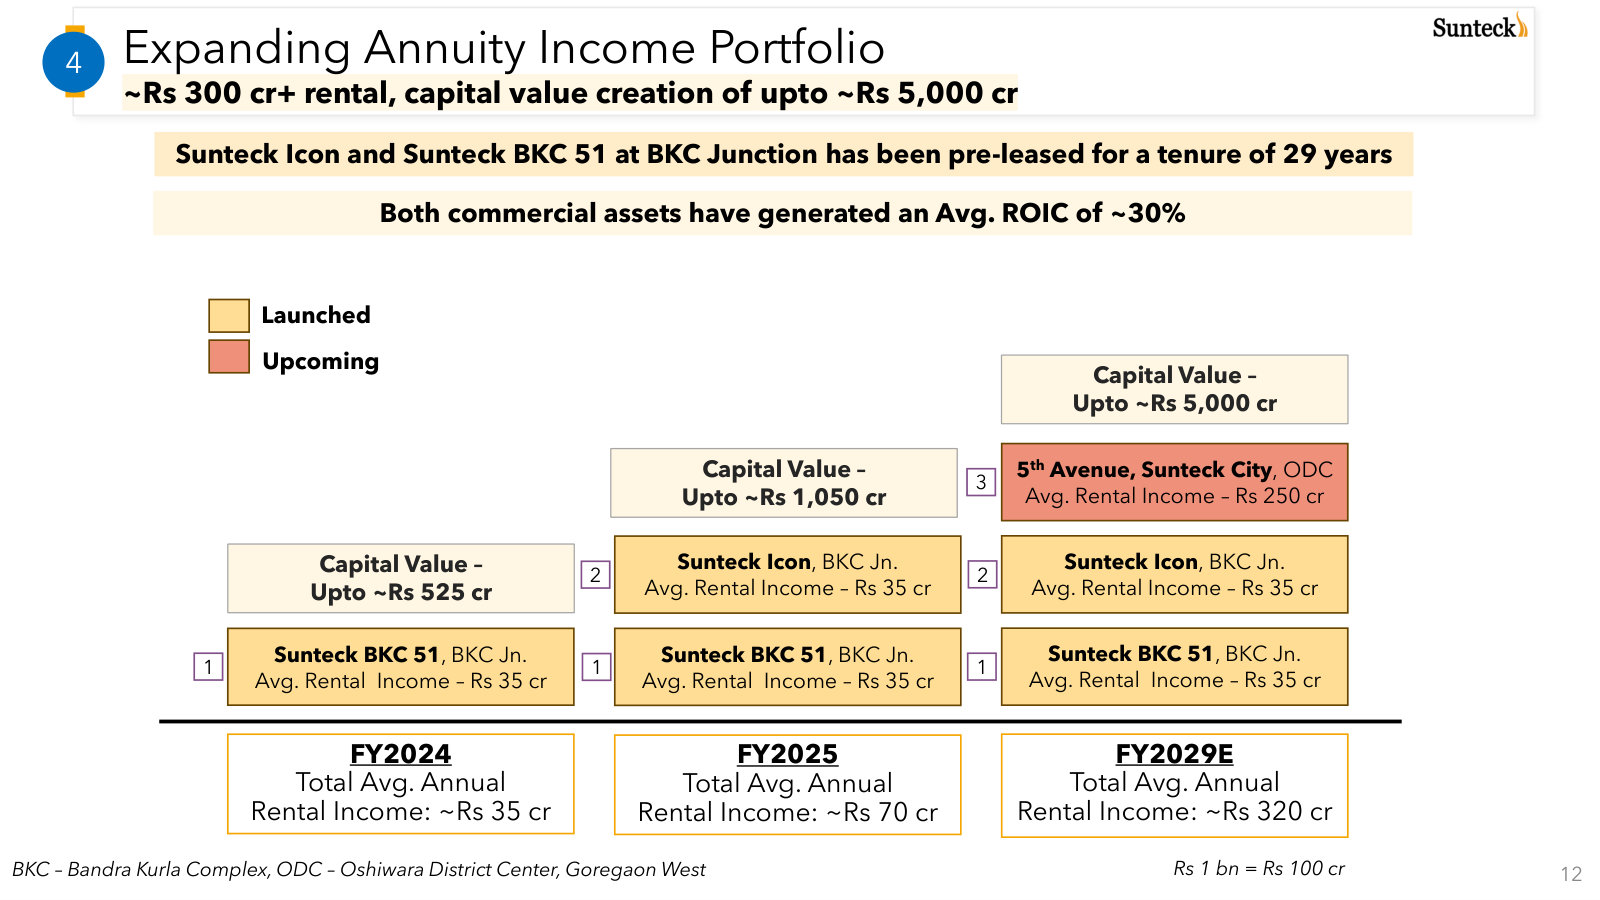
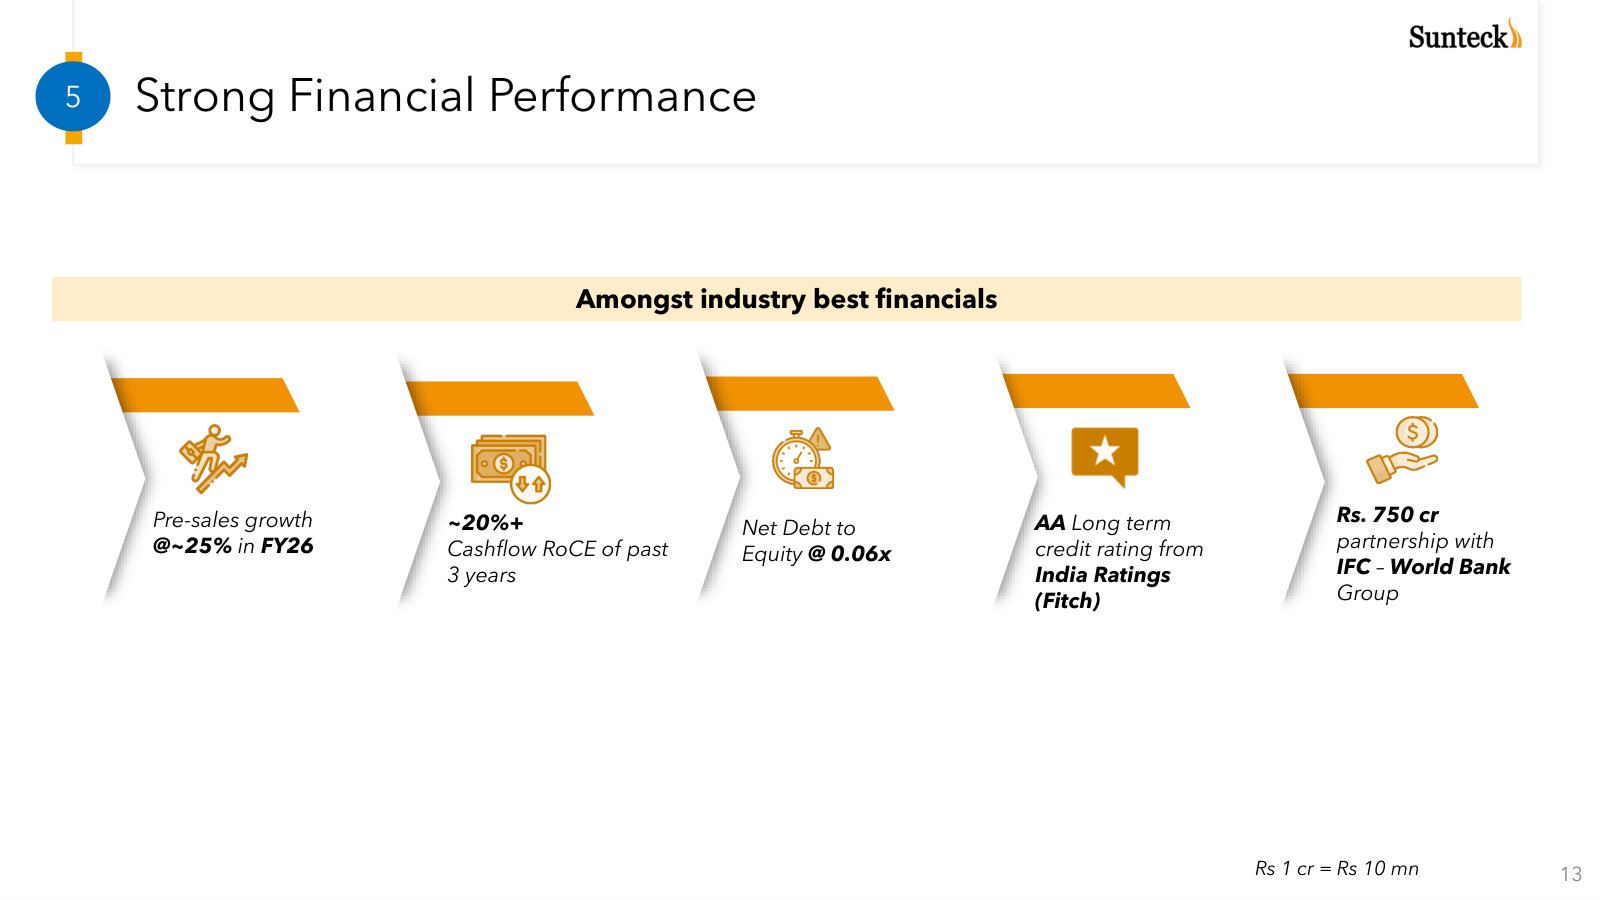
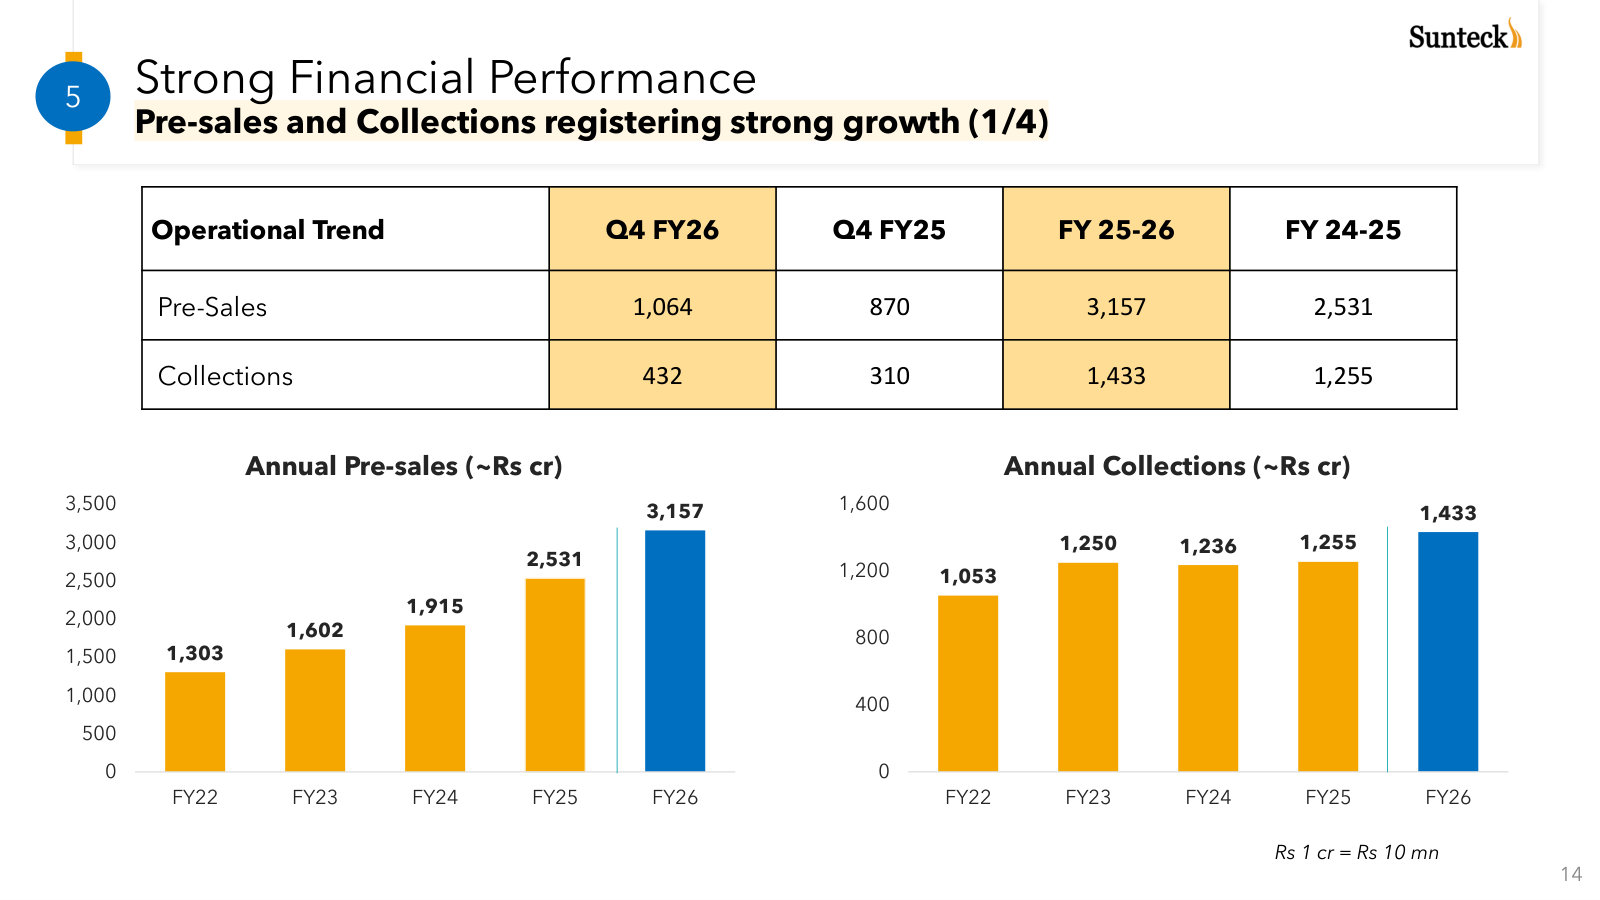
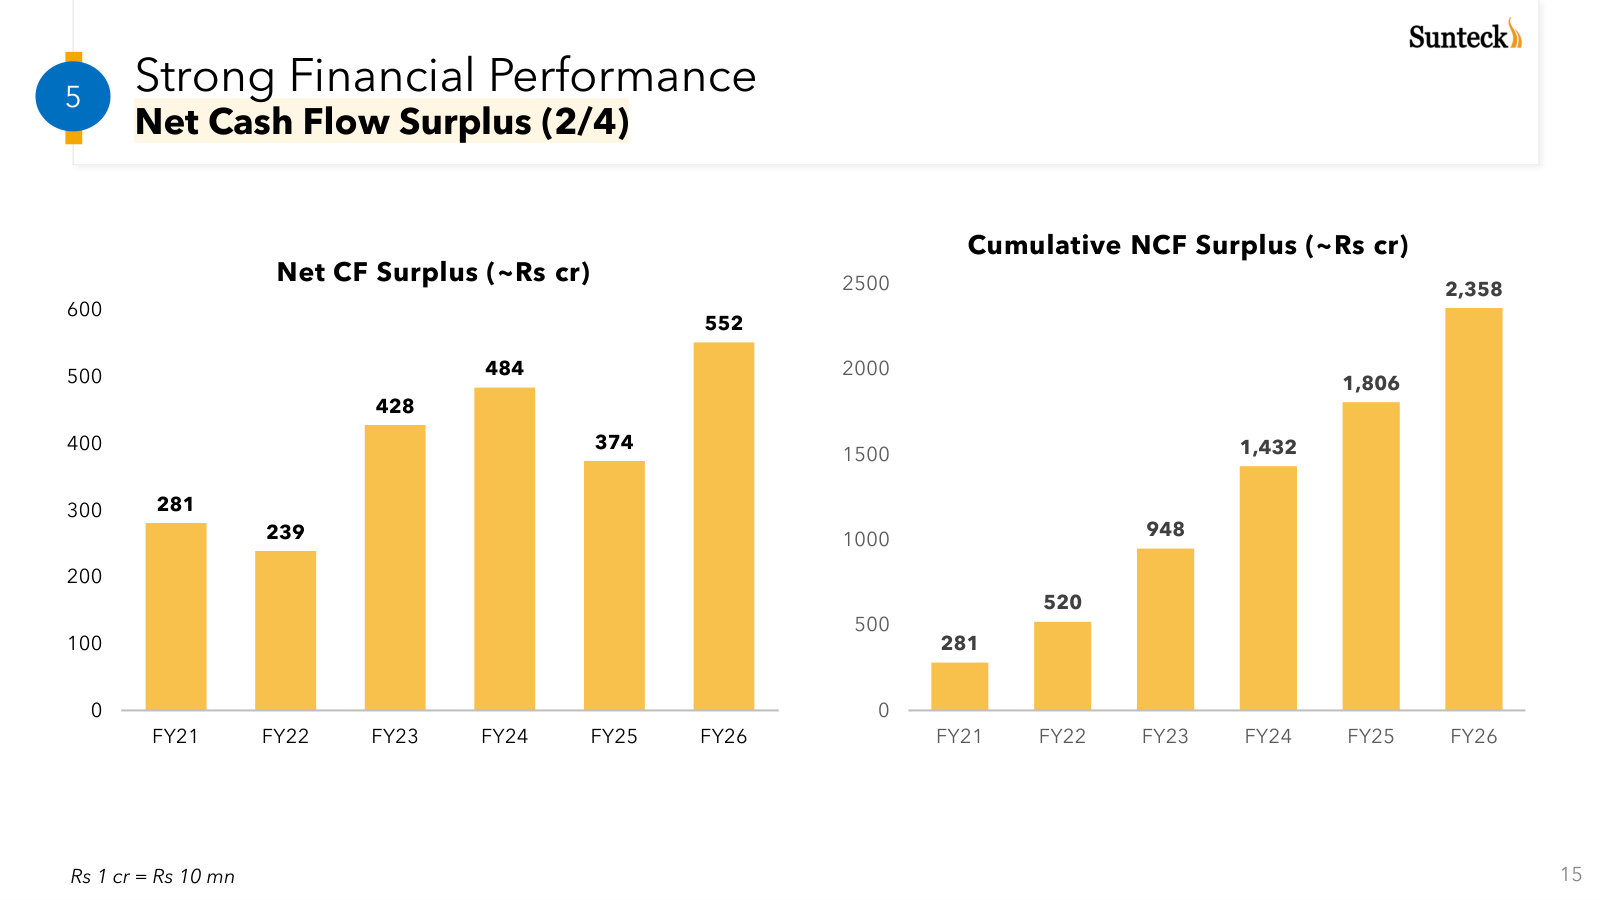
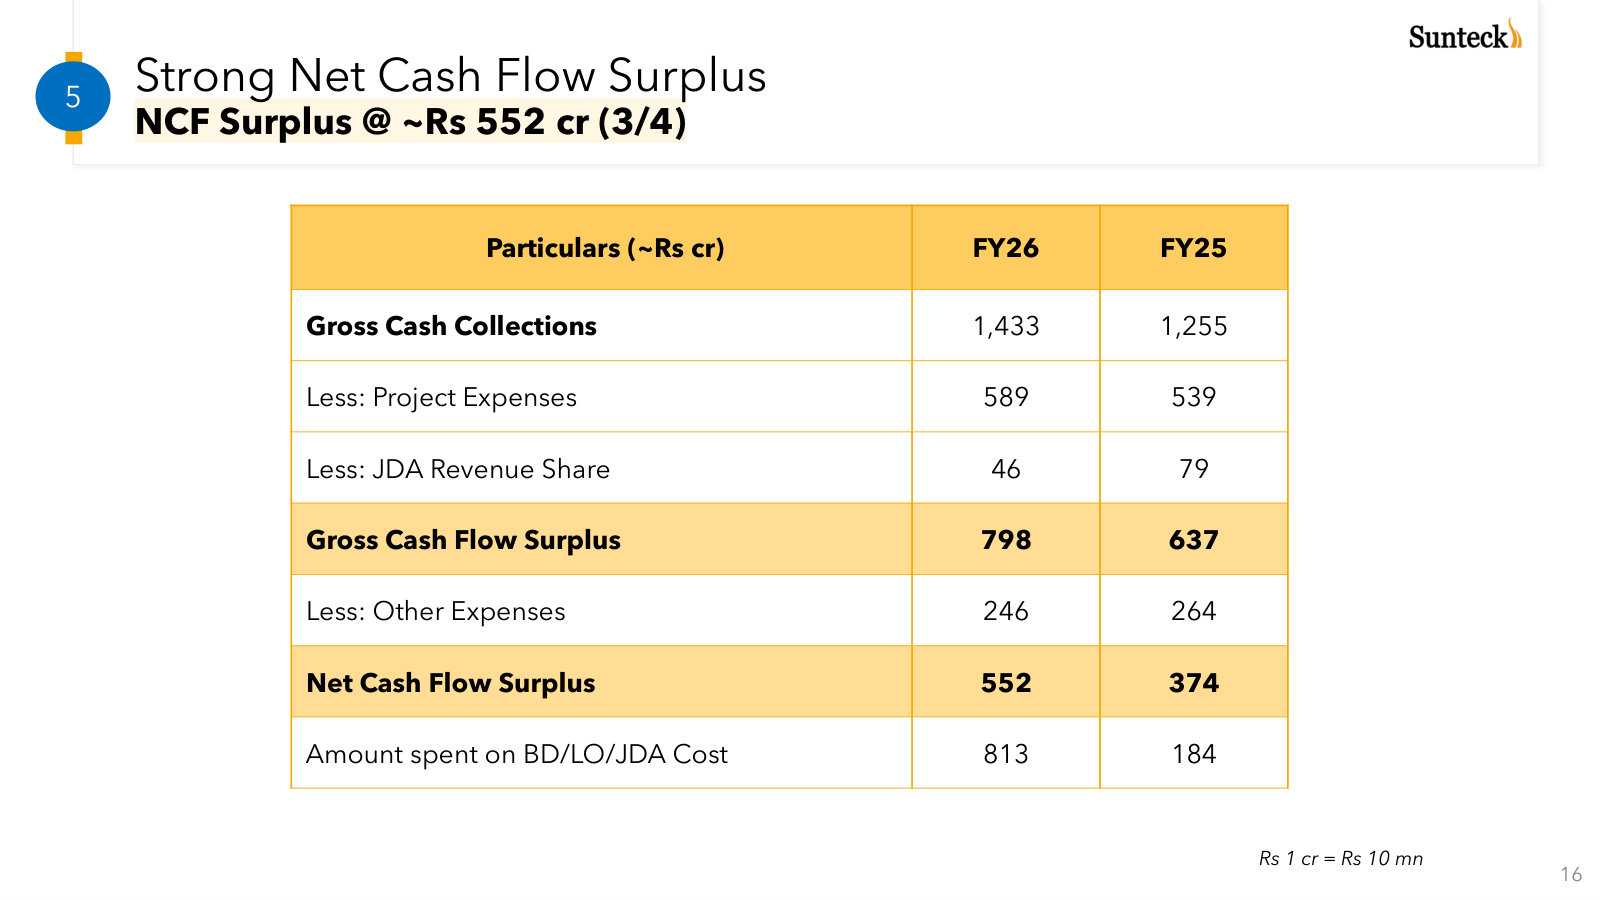
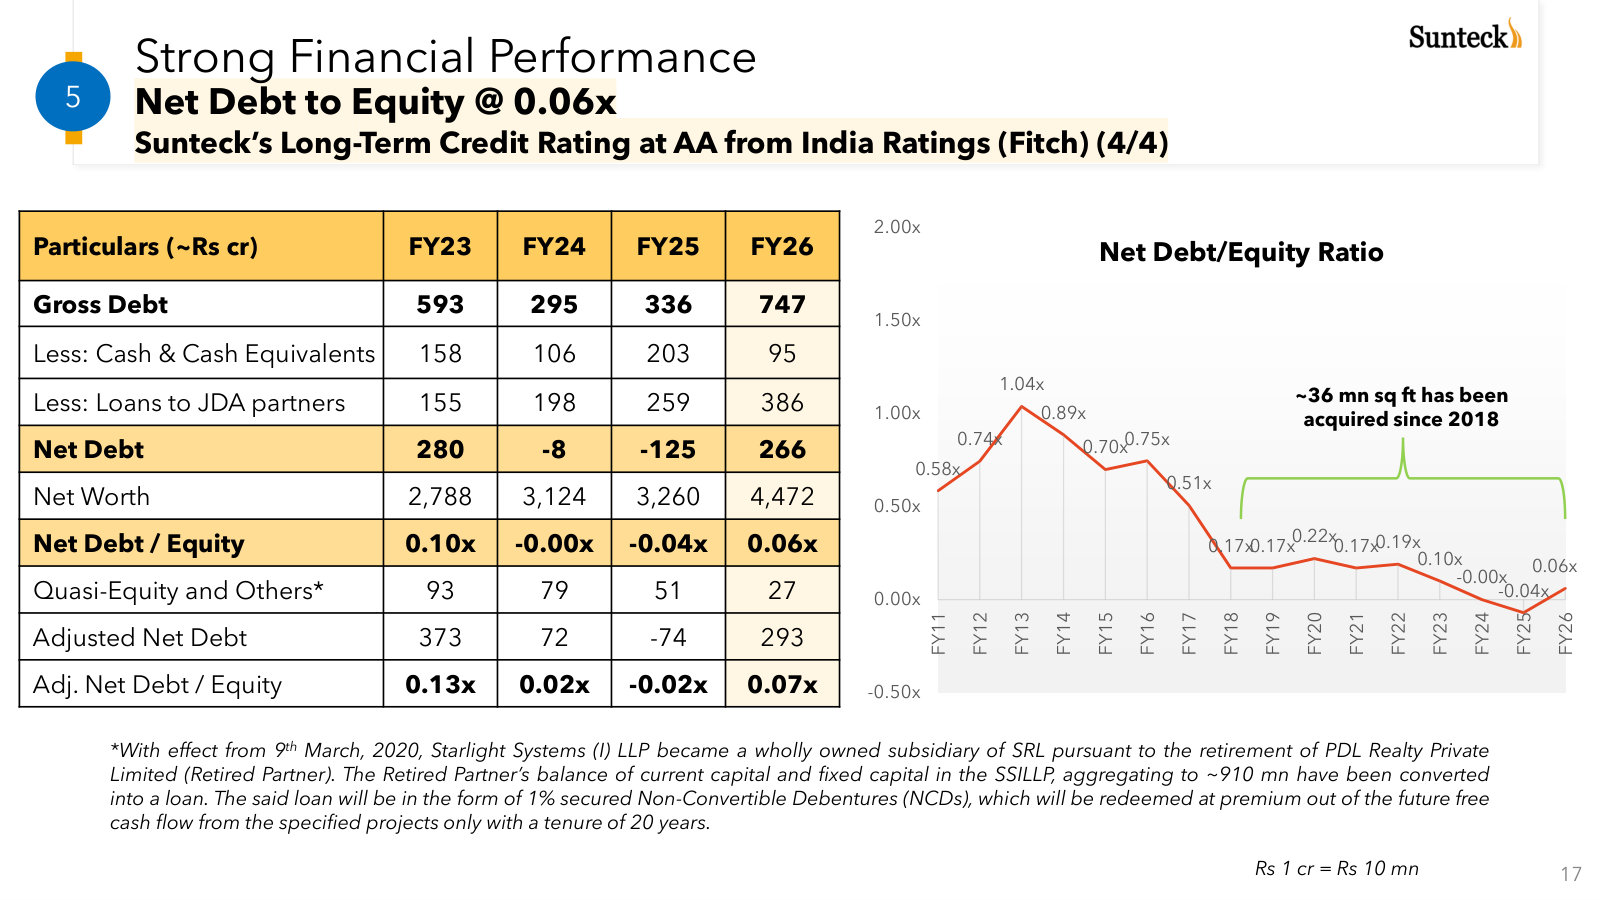
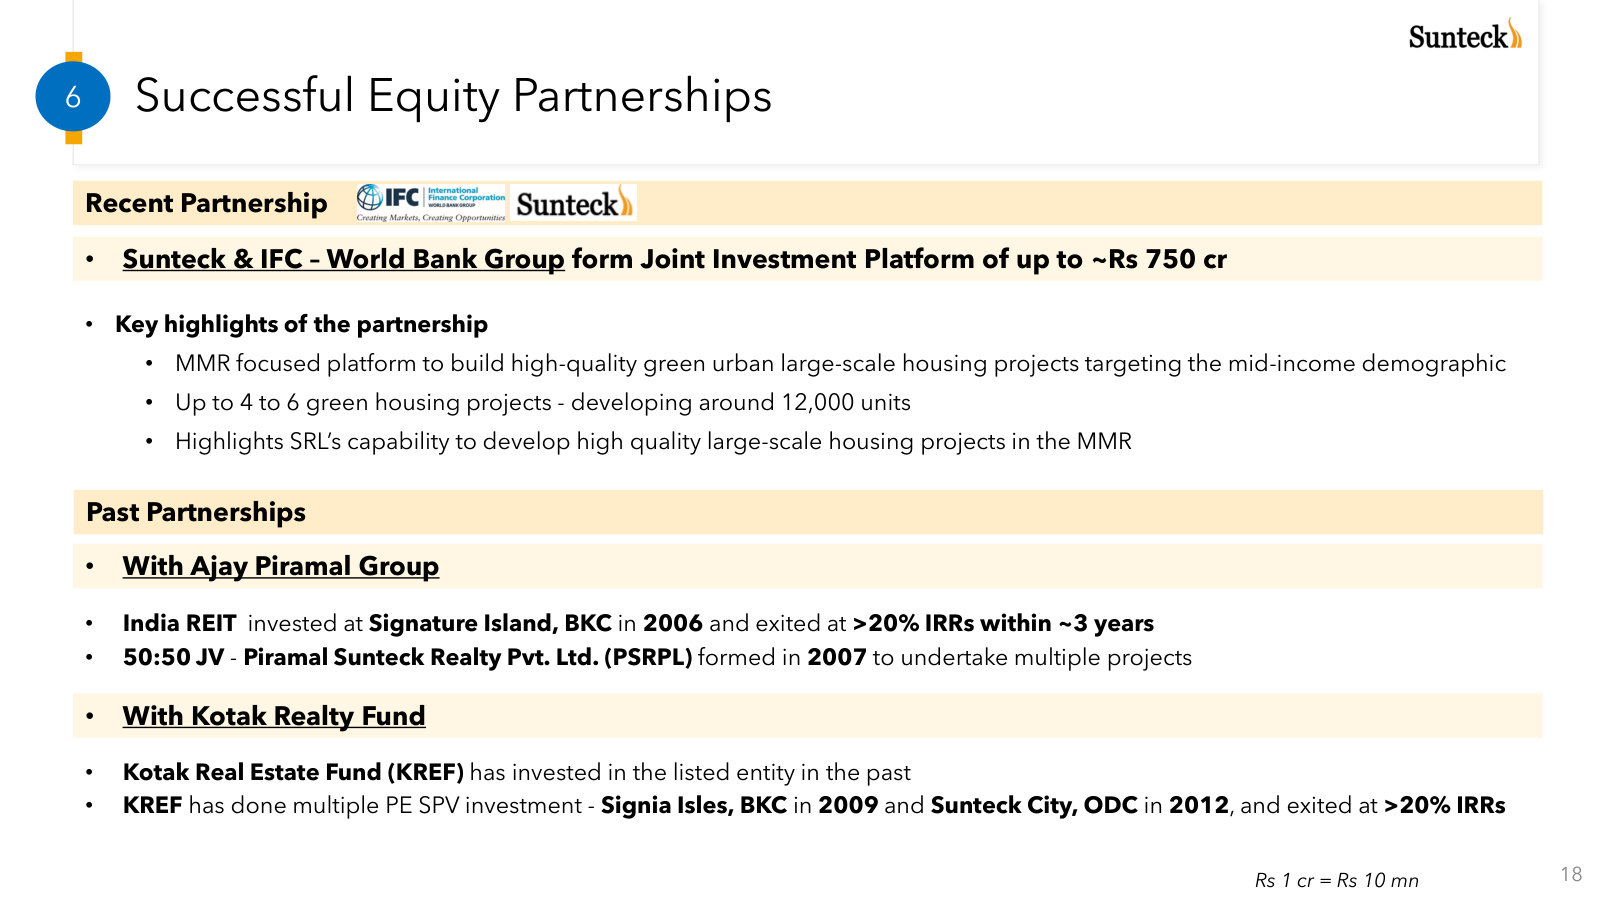
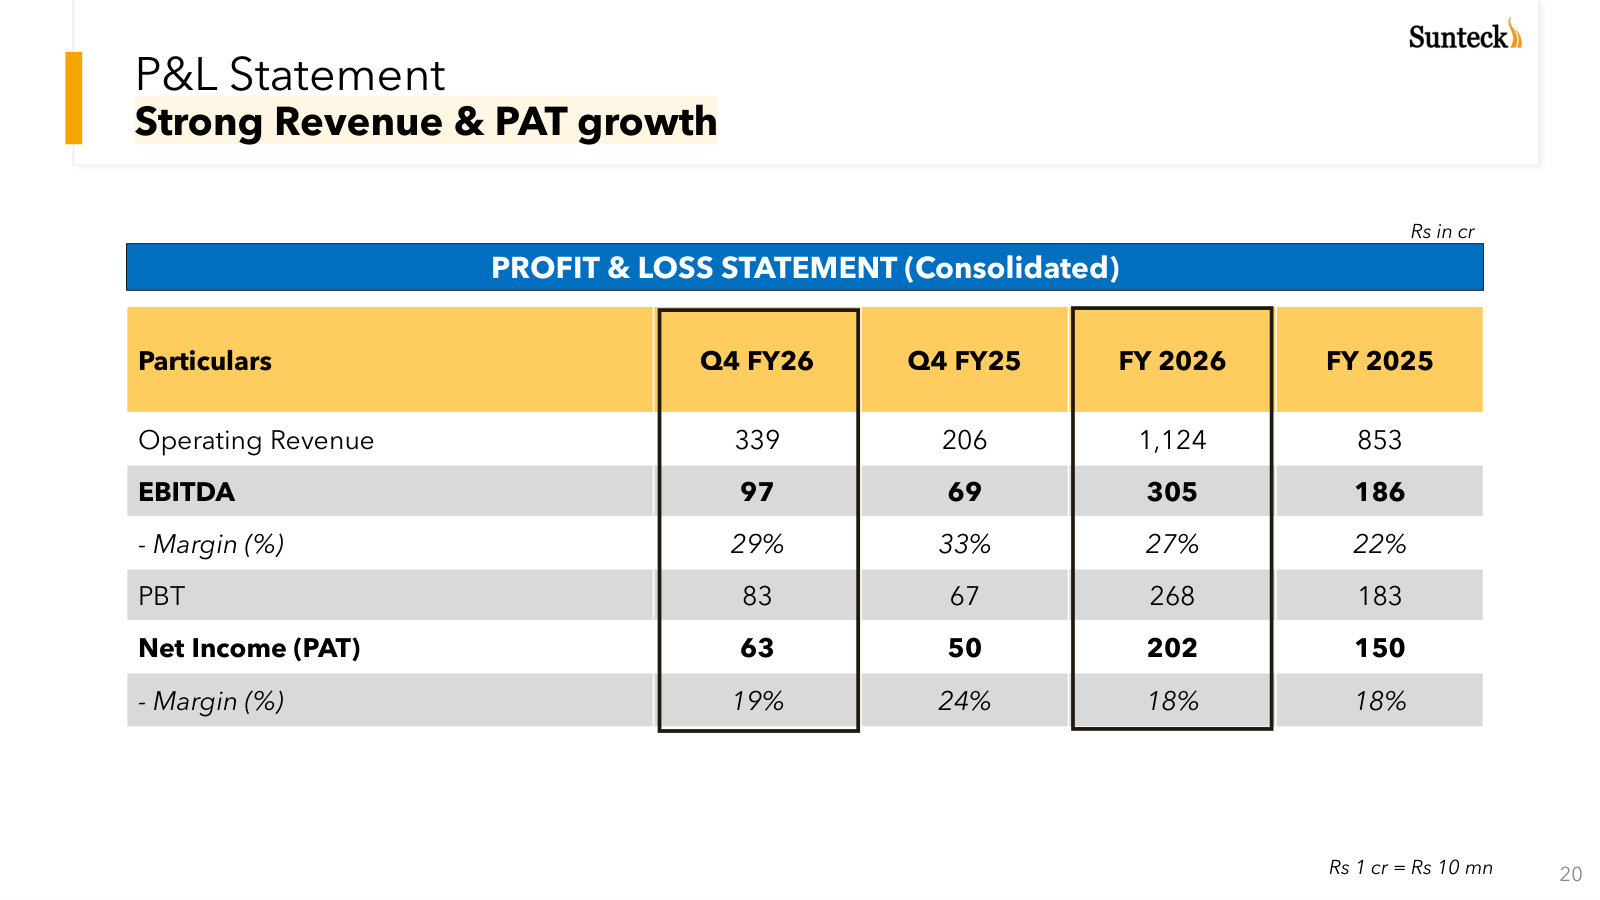
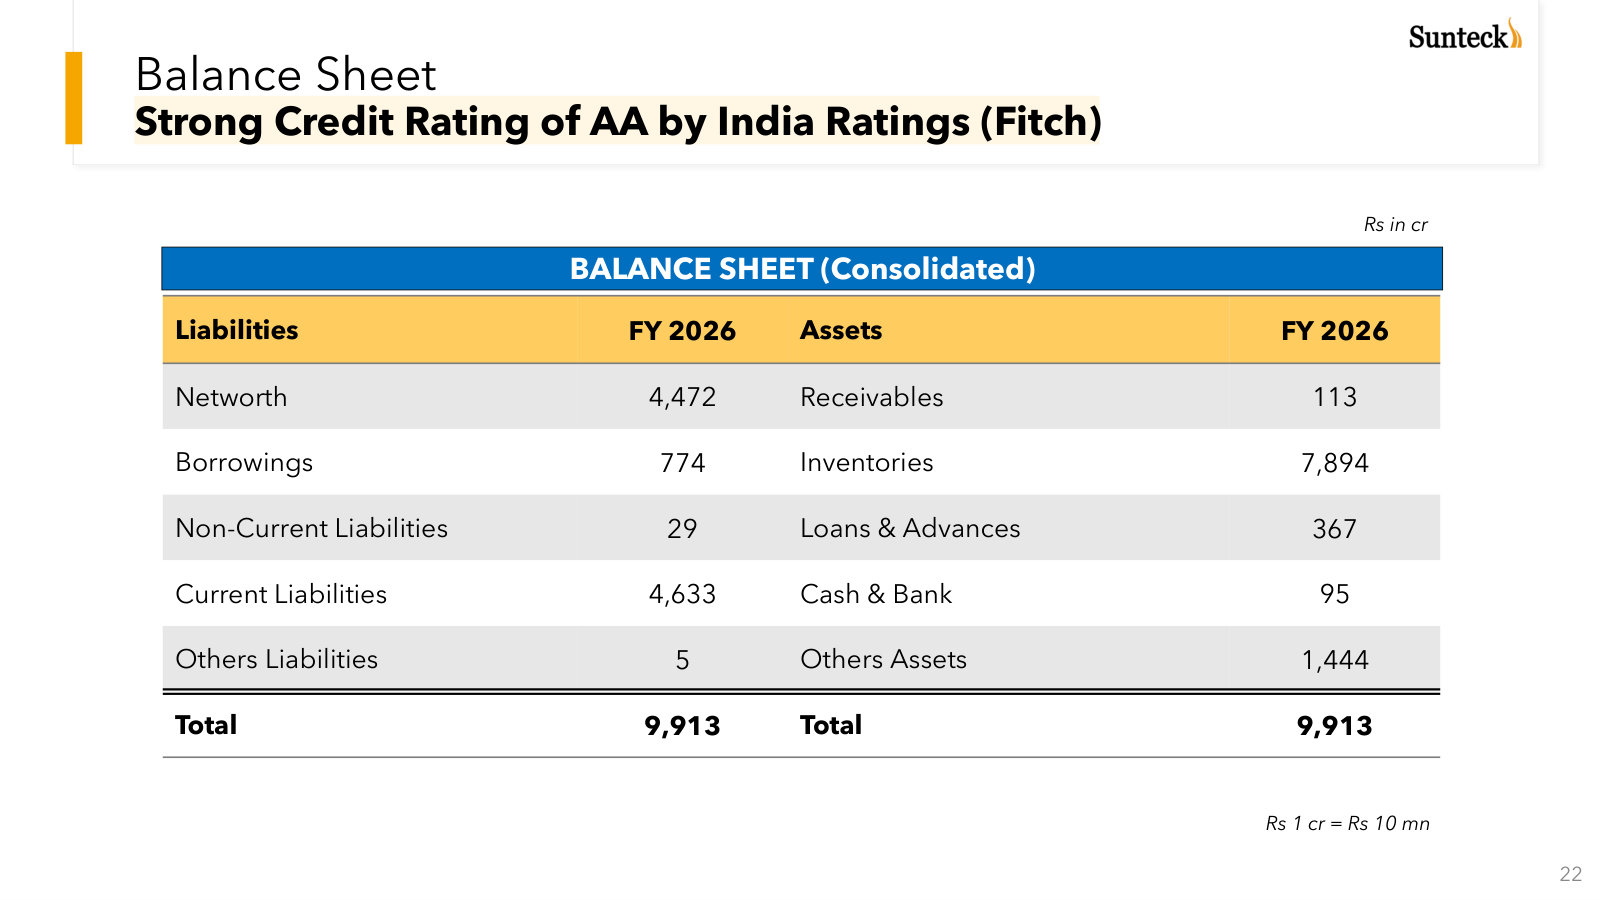
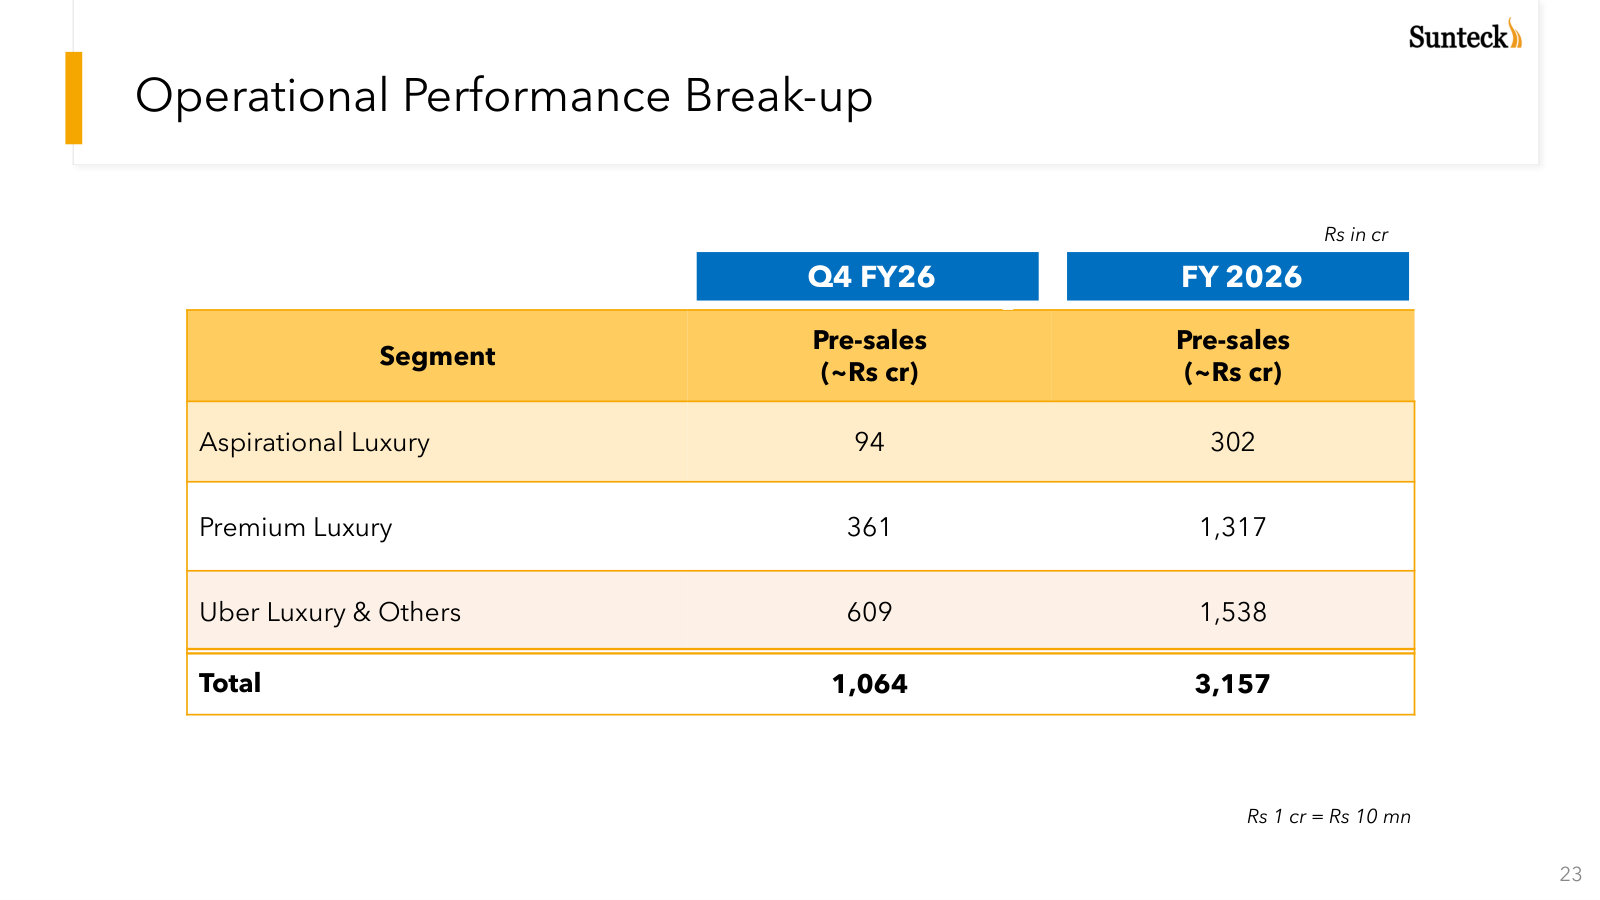
p. 4 — The FY26 scorecard — revenue, EBITDA, PAT, pre-sales, collections and net debt, with year-on-year growth in one view. · Open the full presentation →p. 6 — The whole investment case on one slide: six pillars from MMR foothold to a 0.06x net debt-to-equity balance sheet. · Open the full presentation →p. 7 — Scale snapshot — one of MMR's larger developers, ~Rs 41,030 cr of GDV across ~13 projects, ~50 msf acquired, 20 delivered. · Open the full presentation →p. 8 — Where the portfolio actually sits: two maps place every ongoing, upcoming and completed project across the Mumbai region. · Open the full presentation →p. 9 — Why MMR — India's most valuable housing market (~39% by value) with prices rising and affordability the best in years. · Open the full presentation →p. 10 — How the brands ladder up: Signature/Signia (uber-luxury) down to Sunteck World (aspirational), one brand per income tier. · Open the full presentation →p. 11 — The land-bank build history — twenty years of well-timed outright and joint-development acquisitions totalling ~50 msf. · Open the full presentation →p. 12 — Balance GDV by project and vintage — how ~Rs 41,030 cr of unsold development value is spread across the pipeline. · Open the full presentation →p. 13 — The annuity leg: pre-leased BKC commercial assets at ~30% ROIC, with rental income targeted to grow ~Rs 70 cr to ~Rs 320 cr. · Open the full presentation →p. 14 — The financial identity in five figures — ~25% pre-sales growth, 20%+ cash RoCE, 0.06x leverage, AA rating, IFC partnership. · Open the full presentation →p. 15 — The operating engine over five years: pre-sales up to Rs 3,157 cr and collections to Rs 1,433 cr in FY26. · Open the full presentation →p. 16 — Net cash-flow surplus by year and cumulatively — the case that the model self-funds its own growth. · Open the full presentation →p. 17 — How collections become cash: the bridge from Rs 1,433 cr of gross collections down to Rs 552 cr of net surplus. · Open the full presentation →p. 18 — Balance-sheet discipline — net debt/equity history back to FY11 and the components behind the current 0.06x. · Open the full presentation →p. 19 — The capital partners: the recent ~Rs 750 cr IFC/World Bank green-housing platform, plus past Piramal and Kotak exits above 20% IRR. · Open the full presentation →p. 21 — Consolidated P&L — Q4 and full-year FY26 versus FY25, with revenue, EBITDA, margins and PAT side by side. · Open the full presentation →p. 23 — Consolidated balance sheet — note Rs 7,894 cr of inventory, the land and work-in-progress that underpins the model. · Open the full presentation →p. 24 — Pre-sales split by luxury tier — how the Rs 3,157 cr of FY26 bookings breaks across aspirational, premium and uber-luxury. · Open the full presentation →
Investor Presentation — Q4 & Full Year FY2025 — Q4 & FY2025 · 30 pages · The prior full-year deck — same story a year earlier, and it lists the specific projects under each luxury brand. · Open →
Investor Presentation — Q4 & Full Year FY2024 — Q4 & FY2024 · 31 pages · The FY2024 baseline this management is measured against — where pre-sales, GDV and leverage stood two years ago. · Open →